

Bitcoin Consolidates Near $100K Amid Seller Exhaustion and Weak Institutional Flows

- Bitcoin trades above $100,000, with resistance near $106,000 and support at $100,000.
- ETF outflows and weak derivatives activity signal a cautious market.
- Seller exhaustion near $100,000 hints at short-term recovery potential.
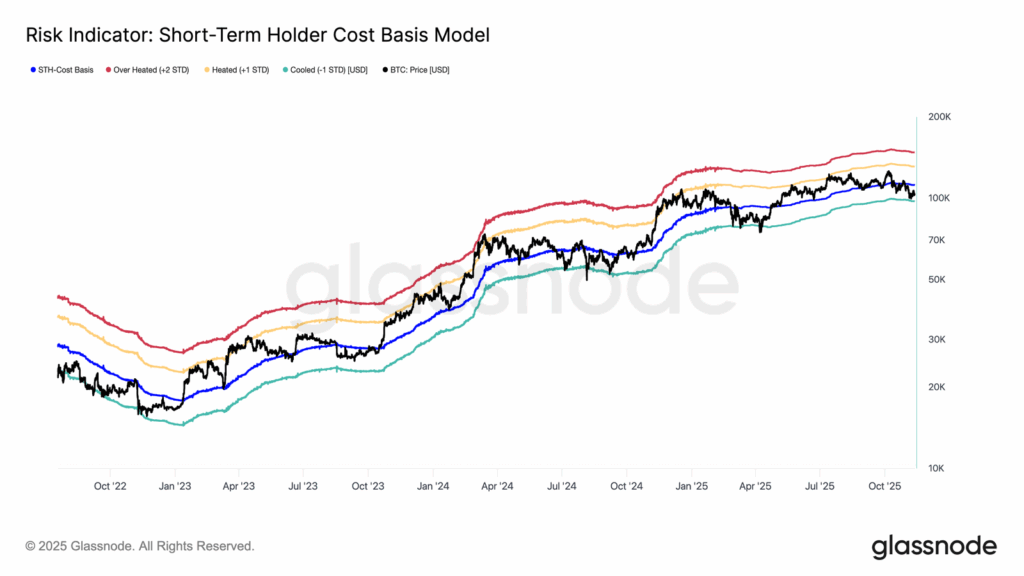
Bitcoin remains in a tight consolidation phase, holding slightly above $100,000 as traders struggle to find direction. According to data from Glassnode, the market has entered a state of low liquidity and reduced conviction since early October, when Bitcoin slipped below the short-term holder cost basis of roughly $111,900.
The coin’s price has since hovered close to the -1 standard deviation band around $97,500. This behavior mirrors previous correction phases, such as those between June–October 2024 and February–April 2025, where prices traded within a compressed range before recovery.
 Source: Glassnode
Unless Bitcoin regains the $111,900 level as solid support, the probability of revisiting the lower end of the $97,000–$100,000 zone remains high. Despite the decline, on-chain patterns now suggest early signs of stabilization as selling momentum fades around $100,000.
Bitcoin Battles to Hold the $100K Support Zone
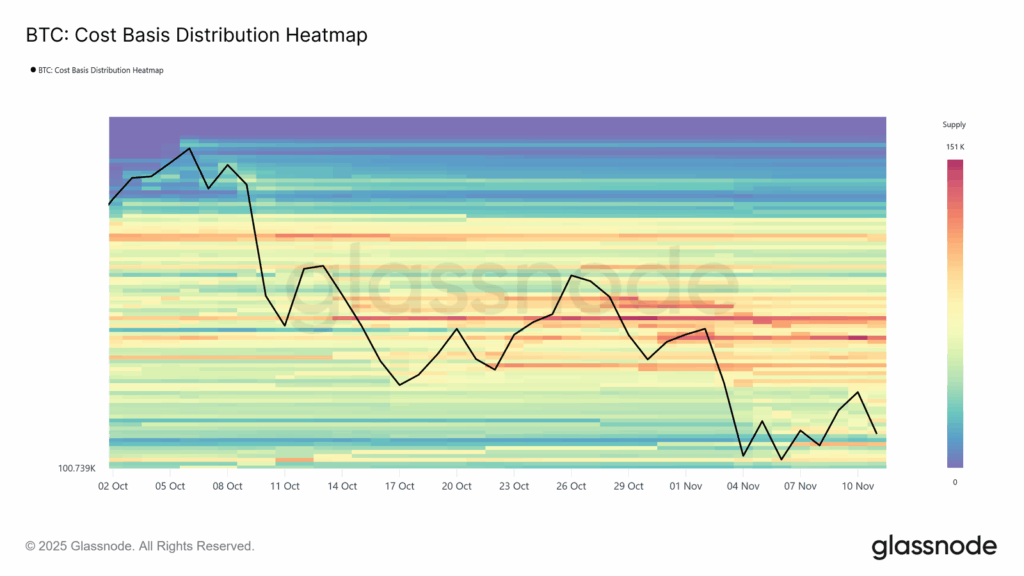
A critical zone below $100,000 has also emerged as a battlefield. Data reveals significant capitulation from short-term holders, as more than 80% of recent value sold at a loss when Bitcoin’s price pushed to $98,000.
This selling exhaustion phase is kind of similar to the biggest market drawdowns in this cycle. As losses accumulate, it appears that the pool of sellers is shrinking, thus preparing for potential buying to accumulate.
The Cost Basis Distribution Heatmap shows an increasing distribution of realized supply in the region of $98,000 to $106,000, meaning that market participants are absorbing selling pressure systematically.
 Source: Glassnode
A psychological stalemate is now being faced by the market; buying demand at $100,000 has to offset selling pressure at $106,000.
A zone of resistance ranging between $106,000 and $118,000 is also capping further upside, as many traders look to close positions at breakevens. For Bitcoin to break above this ceiling, it would require strong demand, accompanied by inflows strong enough to overcome this supply overhang.
Institutional Flows Show Signs of Cooling
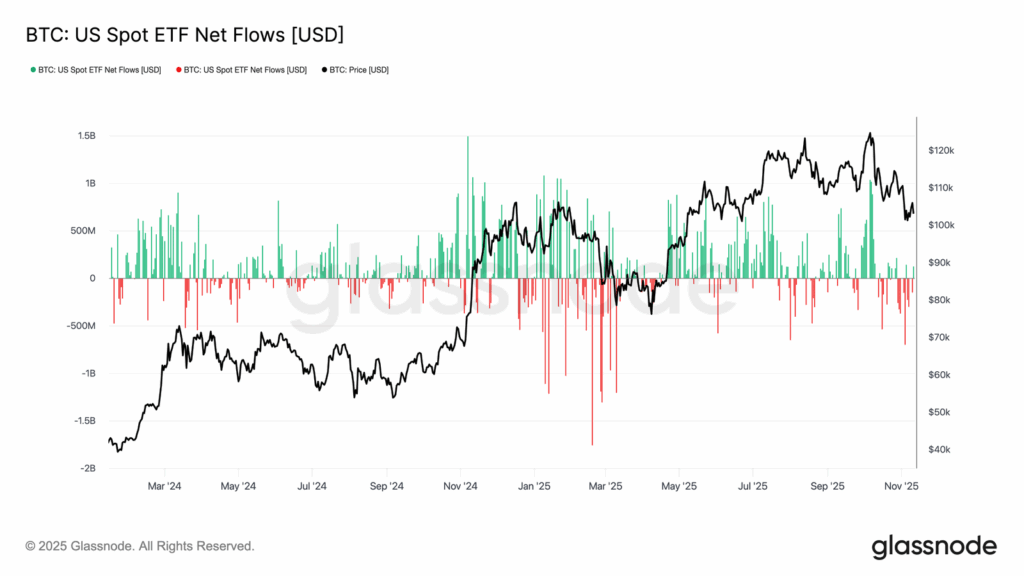
Off-chain signals also reflect the same sentiments. U.S. Bitcoin spot ETFs have continued to register outflows in recent weeks following strong institutional inflows in mid-year. The outflows, coupled with lack of strong market movements, may also suggest that institutional players have been awaiting clear signals to get back into the market.
 Source: Glassnode
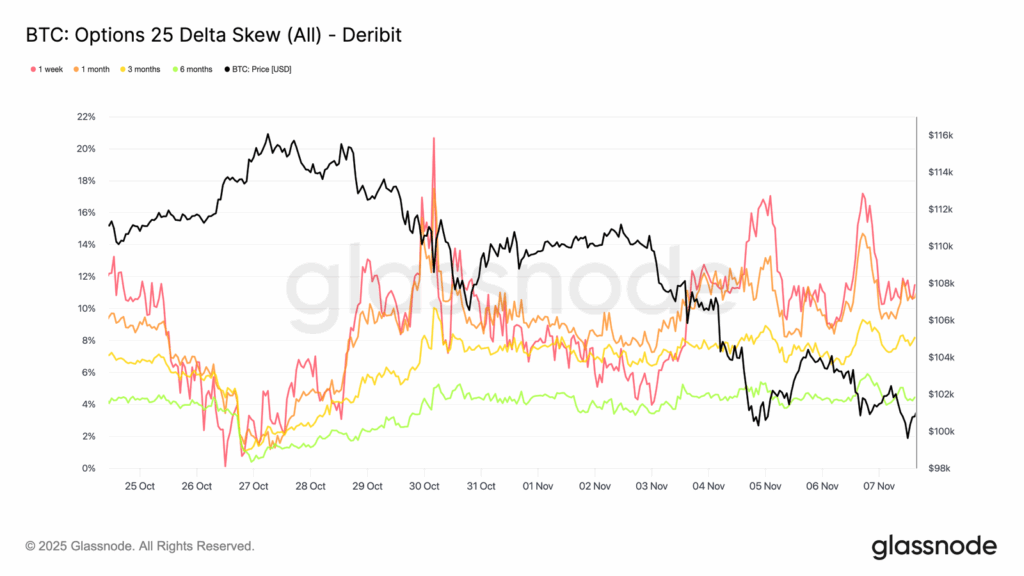
Meanwhile, Bitcoin’s futures funding rates have been muted across exchanges after October’s leverage unwind. Open interest as well as trading volumes have been shrinking, reflecting a lack of speculative interest in Bitcoin’s futures market.
Observers of derivatives data find that traders prefer to sidestep aggressive trades, choosing option protection over making bets in derivatives.
Put demand is strong, and volatilities in the near-term contracts display an 11% skew in downside insurance demand. This is an indication that market participants are hedging against a possible drop below $100,000.
 Source: Glassnode
Also Read: Bitcoin Price Outlook: $125K Target Unlikely for 2025 Rally
You May Also Like

Stripe and Paradigm’s Tempo mainnet goes live for machine payments

Fed Acts on Economic Signals with Rate Cut

