Sui (SUI) is showing signs of a potential rebound after recent losses, currently trading near $1.85. Market analysts are closely monitoring a critical level of support at $1.98, which may trigger a massive shift upward. It is reported that if the SUI token sustains the level, history may repeat itself, and a massive rally towards […]Sui (SUI) is showing signs of a potential rebound after recent losses, currently trading near $1.85. Market analysts are closely monitoring a critical level of support at $1.98, which may trigger a massive shift upward. It is reported that if the SUI token sustains the level, history may repeat itself, and a massive rally towards […]

SUI Rally Potential: Historical Patterns Could Drive Price to $20

sui
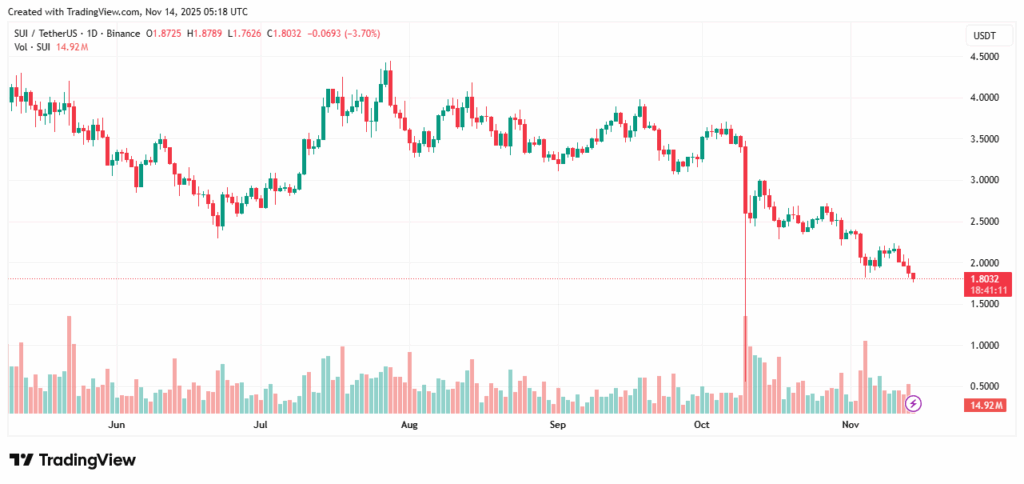
  • SUI is currently trading at $1.80 and has shown a decline of 9.04% over the past day.
  • The key support level at $1.98 could trigger a rise to $2.08 targets.
  • Historical trends indicate a possible rise of 860%, which could further push the SUI to $20.

Sui (SUI) is showing signs of a potential rebound after recent losses, currently trading near $1.85. Market analysts are closely monitoring a critical level of support at $1.98, which may trigger a massive shift upward. It is reported that if the SUI token sustains the level, history may repeat itself, and a massive rally towards $20 may be triggered.

Currently, SUI is trading at $1.80 and has shown a decline of 9.04% within the past 24 hours. Moreover, the trading volume over a period of 24 hours is $1.74 billion, and the market cap is $6.71 billion, with a dominance of 0.20%. Despite the recent decline, analysts see signs of a potential rebound in the near term.

Source: TradingView

Key Support Zone Holds $1.98 Price

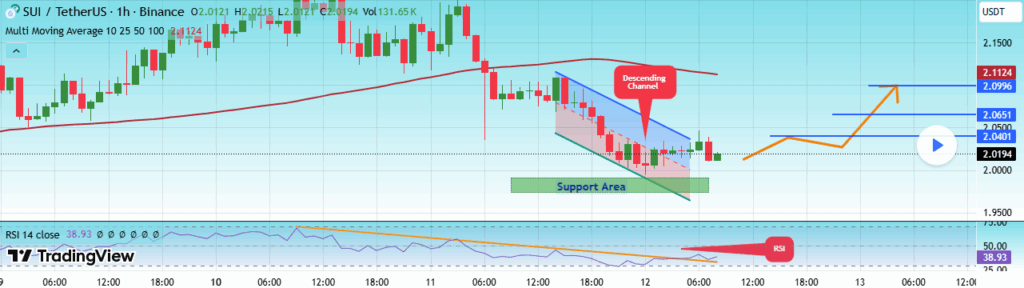
SUI is also trading within a rising channel. The token is closely following the trend of the rising channel. The technical analysis scans indicate that the token could break through and re-test the borders of the token rising channel.

Source: TradingView

The Relative Strength Index (RSI) indicates that the downtrend line is almost reaching the breakout and retest phase, which also indicates a possible upward movement. Moreover, the important level of $1.98 is also creating a robust floor for the prices. Token is also moving above the 100-period moving average, which also depicts a level of confidence.

As for those analyzing possible entry points, a level of $2.02 is viewed as a positive entry point. The targets for the rise are $2.04, $2.06, and $2.08.

Also Read | Ethereum (ETH) Price Outlook: Fear, Bearish Winds, Hope of 10% Rise

Repeating Patterns Could Boost SUI Price

Post by Ali highlights a potential massive upside for SUI, citing historical trends. Referring to the last time SUI hit the bottom of the chart’s support level, the analyst illustrates that the token skyrocketed by a phenomenal 1,060%, implying that if the level continues to hold, the token could see a rise of 860%, pushing the prices towards $20.

Source: X

The traders are closely observing the trend, as it could be a sign of a positive moment for token if history repeats itself. This level could be considered a important trading level for the buying of SUI.

Market analysts are also closely observing the behavior of token near these levels of support and resistance during the upcoming trading sessions. The movement of the cryptocurrency within the channel might influence whether the token can recover its upward trend after the recent drop.

Also Read | Tether Strikes Hard: Authorities Seize 12M USDT in Massive Fraud Case

Market Opportunity
SUI Logo
SUI Price(SUI)
$1.3884
$1.3884$1.3884
-1.91%
USD
SUI (SUI) Live Price Chart
Disclaimer: The articles reposted on this site are sourced from public platforms and are provided for informational purposes only. They do not necessarily reflect the views of MEXC. All rights remain with the original authors. If you believe any content infringes on third-party rights, please contact [email protected] for removal. MEXC makes no guarantees regarding the accuracy, completeness, or timeliness of the content and is not responsible for any actions taken based on the information provided. The content does not constitute financial, legal, or other professional advice, nor should it be considered a recommendation or endorsement by MEXC.

You May Also Like

Uniswap stemt in met token burn van 100 miljoen UNI

Uniswap stemt in met token burn van 100 miljoen UNI

Uniswap (UNI) heeft een belangrijke stap gezet in de verdere ontwikkeling van zijn tokenomics. In een recente governance-stemming hebben houders van het UNI-token
Share
Coinstats2025/12/26 21:47
Which Crypto to Buy Today for Long-Term Growth? One DeFi Crypto Stands Out

Which Crypto to Buy Today for Long-Term Growth? One DeFi Crypto Stands Out

The post Which Crypto to Buy Today for Long-Term Growth? One DeFi Crypto Stands Out appeared on BitcoinEthereumNews.com. Crypto Projects Investors searching for
Share
BitcoinEthereumNews2025/12/26 22:32
Ethereum koers toont zeldzaam dubbel koopsignaal en richt zich op $4.550

Ethereum koers toont zeldzaam dubbel koopsignaal en richt zich op $4.550

Connect met Like-minded Crypto Enthusiasts! Connect op Discord! Check onze Discord   Ethereum laat op de uurgrafiek twee opeenvolgende TD Sequential koopsignalen zien. Deze indicator meet uitputting in een trend en geeft vaak een signaal dat de verkoopdruk kan afnemen. Dit dubbele signaal verschijnt rond het niveau van $4.516, waar de ETH prijs kortstondig steun vindt. Dit type formatie komt zelden voor en wordt daarom extra nauwlettend gevolgd. Wat gaat de Ethereum koers hiermee doen? Ethereum koers test steun rond $4.516 De scherpe daling van de Ethereum koers vanaf de prijszone rond $4.800 bracht de ETH prijs in korte tijd naar ongeveer $4.516. Op dit niveau trad duidelijke koopactiviteit op, waardoor de neerwaartse beweging tijdelijk werd gestopt. Het dubbele signaal dat door de TD Sequential indicator is gegenereerd, viel precies samen met dit prijspunt. De TD Sequential is opgebouwd uit negen candles die een trend meetellen. Wanneer de negende candle verschijnt, kan dit duiden op een trendomslag. In dit geval verschenen zelfs twee signalen kort na elkaar, wat aangeeft dat de verkoopdruk mogelijk uitgeput is. Het feit dat dit gebeurde in een zone waar ETH kopers actief bleven, maakt het patroon extra opvallend. TD Sequential just flashed two buy signals for Ethereum $ETH! pic.twitter.com/JPO8EhiEPi — Ali (@ali_charts) September 16, 2025 Welke crypto nu kopen?Lees onze uitgebreide gids en leer welke crypto nu kopen verstandig kan zijn! Welke crypto nu kopen? Fed-voorzitter Jerome Powell heeft aangekondigd dat de rentes binnenkort zomaar eens omlaag zouden kunnen gaan, en tegelijkertijd blijft BlackRock volop crypto kopen, en dus lijkt de markt klaar om te gaan stijgen. Eén vraag komt telkens terug: welke crypto moet je nu kopen? In dit artikel bespreken we de munten die… Continue reading Ethereum koers toont zeldzaam dubbel koopsignaal en richt zich op $4.550 document.addEventListener('DOMContentLoaded', function() { var screenWidth = window.innerWidth; var excerpts = document.querySelectorAll('.lees-ook-description'); excerpts.forEach(function(description) { var excerpt = description.getAttribute('data-description'); var wordLimit = screenWidth wordLimit) { var trimmedDescription = excerpt.split(' ').slice(0, wordLimit).join(' ') + '...'; description.textContent = trimmedDescription; } }); }); Technische indicatoren schetsen herstelkans voor ETH Naast de dubbele koopsignalen verstrekken ook andere indicatoren belangrijke aanwijzingen. Tijdens de daling van de ETH koers waren grote rode candles zichtbaar, maar na de test van $4.516 stabiliseerde de Ethereum koers. Dit wijst op een mogelijke verschuiving in het evenwicht tussen de bears en bulls. Als deze opwaartse beweging doorzet, liggen de eerste weerstanden rond $4.550. Daarboven wacht een sterkere zone rond $4.650. Deze niveaus zijn in eerdere Ethereum sessies al meerdere keren getest. Een doorbraak zou ruimte openen richting de all-time high van ETH rond $4.953. Wanneer de prijs toch opnieuw onder $4.516 zakt, liggen er zones rond $4.500 en $4.450 waar grotere kooporders worden verwacht. Deze niveaus kunnen als een vangnet fungeren, mocht de druk opnieuw toenemen. Marktdynamiek bevestigt technische indicatoren De huidige situatie volgt op een bredere correctie in de cryptomarkt. Verschillende vooraanstaande crypto tokens zagen scherpe koersdalingen, waarna traders op zoek gingen naar signalen voor een mogelijke ommekeer. Dat juist Ethereum nu een dubbel TD Sequential signaal toont, versterkt de interesse in dit scenario. Fundamenteel blijft Ethereum sterk. Het aantal ETH tokens dat via staking is vastgezet, blijft groeien. Dat verkleint de vrije circulatie en vermindert verkoopdruk. Tegelijk blijft het netwerk intensief gebruikt voor DeFi, NFT’s en stablecoins. Deze activiteiten zorgen voor een stabiele vraag naar ETH, ook wanneer de prijs tijdelijk onder druk staat. Fundamentele drijfveren achter de Ethereum koers De Ethereum koers wordt echter niet alleen bepaald door candles en patronen, maar ook door bredere factoren. Een stijgend percentage van de totale ETH supply staat vast in staking contracten. Hierdoor neemt de liquiditeit op exchanges af. Dit kan prijsschommelingen versterken wanneer er plotseling meer koopdruk ontstaat. Daarnaast is Ethereum nog steeds het grootste smart contract platform. Nieuwe standaarden zoals ERC-8004 en ontwikkelingen rond layer-2 oplossingen houden de activiteit hoog. Deze technologische vooruitgang kan de waardepropositie ondersteunen en zo indirect bijdragen aan een ETH prijsherstel. Het belang van de korte termijn dynamiek De komende handelsdagen zullen duidelijk maken of de bulls genoeg kracht hebben om door de weerstandszone rond $4.550 te breken. Voor de bears ligt de focus juist op het verdedigen van de prijsregio rond $4.516. De whales, die met grote handelsorders opereren, kunnen hierin een beslissende rol spelen. Het dubbele TD Sequential signaal blijft hoe dan ook een zeldzame gebeurtenis. Voor cryptoanalisten vormt het een objectief aanknopingspunt om de kracht van de huidige Ethereum trend te toetsen. Vooruitblik op de ETH koers Ethereum liet twee opeenvolgende TD Sequential signalen zien op de uurgrafiek, iets wat zelden voorkomt. Deze formatie viel samen met steun rond $4.516, waar de bulls actief werden. Als de Ethereum koers boven dit niveau blijft, kan er ruimte ontstaan richting $4.550 en mogelijk $4.650. Zakt de prijs toch opnieuw onder $4.516, dan komen $4.500 en $4.450 in beeld als nieuwe steunzones. De combinatie van zeldzame indicatoren en een sterke fundamentele basis maakt Ethereum interessant voor zowel technische als fundamentele analyses. Of de bulls het momentum echt kunnen overnemen, zal blijken zodra de Ethereum koers de eerstvolgende weerstanden opnieuw test. Koop je crypto via Best Wallet Best wallet is een topklasse crypto wallet waarmee je anoniem crypto kan kopen. Met meer dan 60 chains gesupport kan je al je main crypto coins aanschaffen via Best Wallet. Best wallet - betrouwbare en anonieme wallet Best wallet - betrouwbare en anonieme wallet Meer dan 60 chains beschikbaar voor alle crypto Vroege toegang tot nieuwe projecten Hoge staking belongingen Lage transactiekosten Best wallet review Koop nu via Best Wallet Let op: cryptocurrency is een zeer volatiele en ongereguleerde investering. Doe je eigen onderzoek. Het bericht Ethereum koers toont zeldzaam dubbel koopsignaal en richt zich op $4.550 is geschreven door Dirk van Haaster en verscheen als eerst op Bitcoinmagazine.nl.
Share
Coinstats2025/09/17 23:31