Tron crypto daily outlook: TRX positioning and next moves
 In this note on Tron crypto, you will find a clear reading of the daily context and the intraday cues, plus pragmatic scenarios for what might come next. The pair TRX/USDT sits under the microscope today as traders consider whether the current pause will resolve into a directional move.
Summary on Tron crypto
Daily indicators point to a market in limbo with a slight bearish tilt. The 20 60 EMAs sit above price, and the 200-day average is roughly level with the mid-Bollinger band. Moreover, momentum metrics show subdued activity rather than conviction.
Volatility has contracted, while the broader crypto market has lost value in the last 24 hours. That said, on-chain DEX fee flows on the TRON ecosystem have spikes in specific venues. Overall, investors appear cautious, preferring to wait for clearer directional confirmation.
Tron crypto: Market Context and Direction
Market capitalization dynamics show crypto-wide weakness, with the total market cap near market strength testing after a nearly 7% fall in 24 hours. BTC dominance sits at 57.51%, which often pulls altcoins into sideways or weaker moves.
The Fear & Greed Index registers 16, an “Extreme Fear” reading, and this suggests traders are risk-averse. In contrast, TRX holds a small share of the overall market at 0.83% of total capitalization, indicating it is vulnerable to broad flows rather than independent rallies.
Technical Outlook: reading the overall setup
On the daily chart the close is 0.29 while the 20-day EMA is 0.30 and the 50-day EMA is 0.31. The fact that short-term averages sit above price implies a lack of upward momentum and a bias toward consolidation or mild downside. trend confirmation
RSI at 42.12 reads as neutral-to-weak, below the midpoint and therefore not signaling buyers in control. This suggests momentum is mixed and that attempts to push higher may meet selling interest. short-term momentum
MACD values are essentially flat (line -0.01, signal -0.01, hist 0), indicating no clear directional impulse is present. That implies traders should not expect a strong trending move without fresh catalysts. momentum check
Bollinger Bands center at 0.29 with an upper band near 0.30 and lower near 0.28. The band width is narrow, which shows compression rather than expansion. This points to a potential volatility expansion if price breaks out of the range, but for now the structure favors sideways trading.
The ATR on the daily series is 0.01, a small absolute value that confirms low realized volatility. Lower ATR means smaller stop distances are possible, but also that breakouts could fail without volume backing. liquidity squeeze
The official daily pivot levels are all around 0.29. In practice, when pivot, support and resistance cluster tightly it creates a zone where price can oscillate. Traders will watch whether price respects that band or decisively leaves it. supportive congestion
Intraday Perspective and ADA token Momentum
Hourly and 15-minute frames show almost identical numbers to the daily close: EMAs are flat at 0.29 and RSI sits in the mid-40s. Meanwhile, MACD and Bollinger metrics read neutral on intraday charts as well. As a result, short-term traders are aligned with the larger neutral picture rather than diverging into a clear trend. breakout setup
Because intraday averages and momentum do not contradict the daily, scalpers will likely wait for volume confirmation. If intraday volatility picks up and a candle closes convincingly above the clustered EMAs, momentum traders could join. Otherwise, range-bound activity is the most likely short-term outcome.
Key Levels and Market Reactions
Price behavior around the 0.29 zone is decisive: a sustained move above the 20/50 EMAs would reduce selling pressure and suggest buyers are reasserting control. Conversely, a drop below the lower Bollinger band near 0.28 would signal that sellers are active and could accelerate downside. Traders should treat the clustered pivot area as the immediate battleground: repeated rejections there would reinforce the mild bearish bias, while a clean breach upward would offer a first sign of recovery. bearish pressure
Future Scenarios and Investment Outlook
Overall the main scenario for Tron crypto is neutral with a slight bearish skew based on daily averages and subdued momentum. If market-wide stress eases and BTC stabilizes, TRXUSDT could retest the 0.30+ area; in contrast, continued risk-off and a breakdown below 0.28 would invite deeper consolidation. Traders should size positions to the low ATR and prefer confirmation from volume or DEX fee trends before leaning decisively long. market strength
This analysis is for informational purposes only and does not constitute financial advice.
Readers should conduct their own research before making investment decisions.


You May Also Like
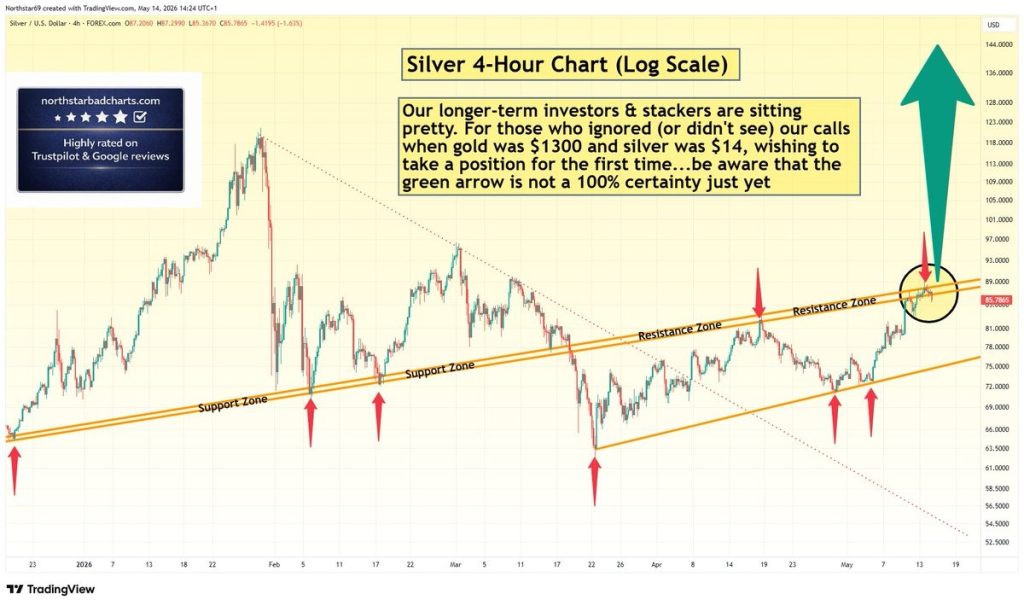
Silver Price Warning: Green Arrow Setup Is Not Confirmed – Wait for Clear Signal

Facebook spotlights African cinema in 6th ‘Made by Africa, loved by the world’ campaign