PEPE (PEPE) has been facing significant selling pressure, with its price hovering near a critical support zone around $0.00000068. Despite the immense sales volume, this level has been sustaining, which could hint at a potential upside breakout. The accumulation/sell ratio has been slightly weak. In the last week, PEPE has been range-bound, with small increments, […]PEPE (PEPE) has been facing significant selling pressure, with its price hovering near a critical support zone around $0.00000068. Despite the immense sales volume, this level has been sustaining, which could hint at a potential upside breakout. The accumulation/sell ratio has been slightly weak. In the last week, PEPE has been range-bound, with small increments, […]

PEPE Set to Plunge Toward $0.00000185 After Head-and-Shoulders Pattern

2025/11/16 20:00
3 min read
For feedback or concerns regarding this content, please contact us at [email protected]
PEPE Set to Plunge Toward $0.00000185 After Head-and-Shoulders Pattern
  • PEPE is currently trading at $0.0000005003 while having a volume of $430.7 million.
  • Head-and-Shoulders pattern confirmed, warning of a possible fall to $0.00000185.
  • The recent plunge of 7.4% shows vulnerabilities; the key level of support might fail at $0.00000068.

PEPE (PEPE) has been facing significant selling pressure, with its price hovering near a critical support zone around $0.00000068. Despite the immense sales volume, this level has been sustaining, which could hint at a potential upside breakout. The accumulation/sell ratio has been slightly weak.

In the last week, PEPE has been range-bound, with small increments, but it dropped noticeably between $0.0000005704 and $0.0000005281, which represented a depreciation of roughly 7.4%. The sharp drop in the value of PEPE raises fears of potential weaknesses in the coin in the short term.

Currently, PEPE is trading at $0.0000005003, along with a trade volume of $430.70 million in the last 24 hours, along a market capitalization of $2.10 billion. The market dominance of the coin stands at 0.06%, along with a drop in the price of 1.46% in the last day.
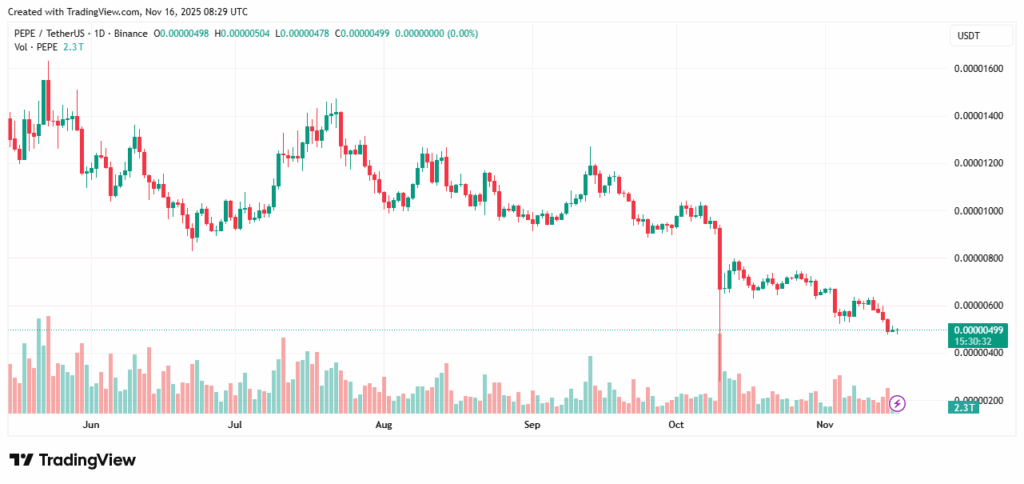
Source: TradingView

PEPE Confirms Head-and-Shoulders Bearish Setup

PEPE has identified a classic head-and-shoulders pattern, predicting the possibility of a reversal in its price actions. Crypto analyst Ali Marteniz highlighted that the identified technical mark could result in the following target price, which in this case stands at $0.00000185.
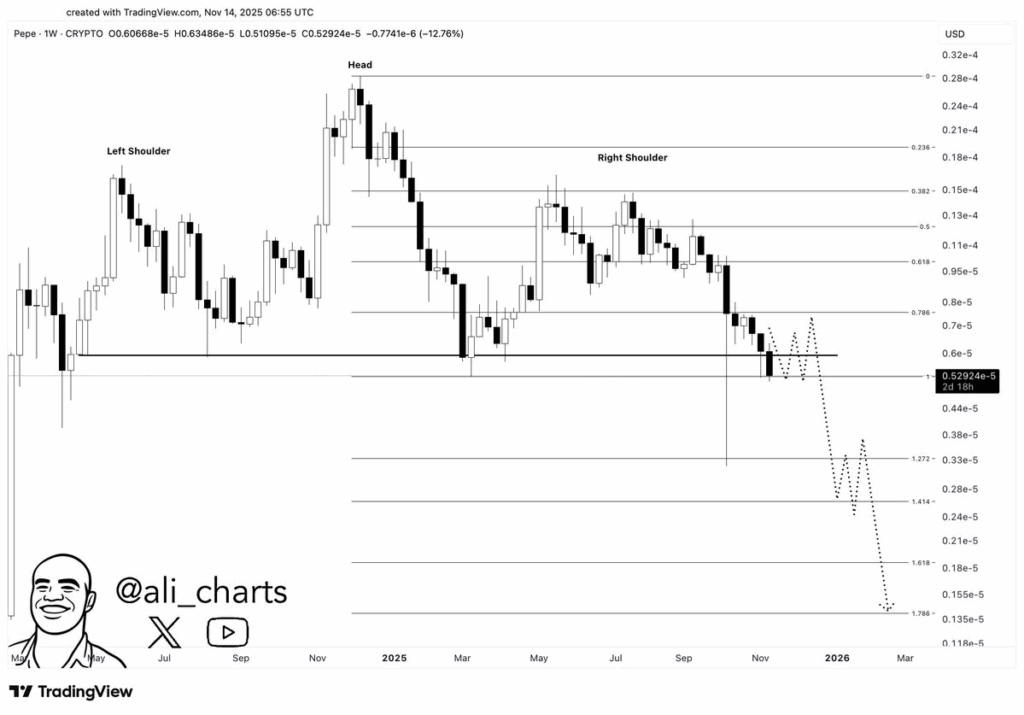
Source: X

Volume analysis shows moderate activity, suggesting that while the pattern is confirmed, decisive price movement may depend on upcoming market catalysts. Analysts advise taking care, considering the level of the Stop-Loss order.

Also Read | Ethereum Approaches Key Breakout Zone as Market Eyes $3,350 Level

Break of Key Level Could Trigger Further Decline

Based on technical analysis, it appears that PEPE might have created a “head and shoulders” formation, thereby indicating the possibility of the existing downtrend persisting. According to the charts available on TradingView, the target might reach the 161.8% extension of the fibonacci line in relation to the movement identified as “AB” if the pattern holds, as indicated by the breach of the neckline.
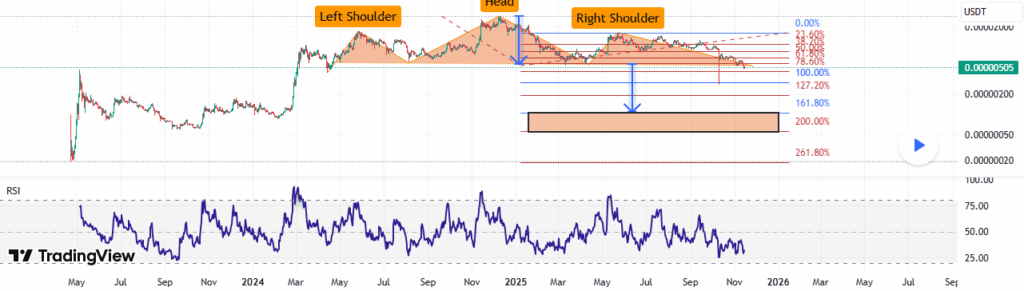
Source: TradingView

Although it has received some respite from the support zone around $0.00000068, the market remains cautious. The next actions of PEPE are currently of great interest to investors as they await signs as to whether a rebound may occur, rather than continued declines.

Also Read | AAVE Wins MiCA Authorization: Rally Ahead or Return to the $125 Zone?

Market Opportunity
Pepe Logo
Pepe Price(PEPE)
$0.000003515
$0.000003515$0.000003515
+1.29%
USD
Pepe (PEPE) Live Price Chart
Disclaimer: The articles reposted on this site are sourced from public platforms and are provided for informational purposes only. They do not necessarily reflect the views of MEXC. All rights remain with the original authors. If you believe any content infringes on third-party rights, please contact [email protected] for removal. MEXC makes no guarantees regarding the accuracy, completeness, or timeliness of the content and is not responsible for any actions taken based on the information provided. The content does not constitute financial, legal, or other professional advice, nor should it be considered a recommendation or endorsement by MEXC.

You May Also Like

Lombard (BARD) Plunges 37.6% in 24 Hours: On-Chain Data Reveals Deeper Issues

Lombard (BARD) Plunges 37.6% in 24 Hours: On-Chain Data Reveals Deeper Issues

Lombard Protocol's native token BARD experienced a sharp 37.6% decline to $0.67, erasing $91 million in market capitalization within 24 hours. Our analysis of on
Share
Blockchainmagazine2026/03/19 07:04
Polygon Tops RWA Rankings With $1.1B in Tokenized Assets

Polygon Tops RWA Rankings With $1.1B in Tokenized Assets

The post Polygon Tops RWA Rankings With $1.1B in Tokenized Assets appeared on BitcoinEthereumNews.com. Key Notes A new report from Dune and RWA.xyz highlights Polygon’s role in the growing RWA sector. Polygon PoS currently holds $1.13 billion in RWA Total Value Locked (TVL) across 269 assets. The network holds a 62% market share of tokenized global bonds, driven by European money market funds. The Polygon POL $0.25 24h volatility: 1.4% Market cap: $2.64 B Vol. 24h: $106.17 M network is securing a significant position in the rapidly growing tokenization space, now holding over $1.13 billion in total value locked (TVL) from Real World Assets (RWAs). This development comes as the network continues to evolve, recently deploying its major “Rio” upgrade on the Amoy testnet to enhance future scaling capabilities. This information comes from a new joint report on the state of the RWA market published on Sept. 17 by blockchain analytics firm Dune and data platform RWA.xyz. The focus on RWAs is intensifying across the industry, coinciding with events like the ongoing Real-World Asset Summit in New York. Sandeep Nailwal, CEO of the Polygon Foundation, highlighted the findings via a post on X, noting that the TVL is spread across 269 assets and 2,900 holders on the Polygon PoS chain. The Dune and https://t.co/W6WSFlHoQF report on RWA is out and it shows that RWA is happening on Polygon. Here are a few highlights: – Leading in Global Bonds: Polygon holds 62% share of tokenized global bonds (driven by Spiko’s euro MMF and Cashlink euro issues) – Spiko U.S.… — Sandeep | CEO, Polygon Foundation (※,※) (@sandeepnailwal) September 17, 2025 Key Trends From the 2025 RWA Report The joint publication, titled “RWA REPORT 2025,” offers a comprehensive look into the tokenized asset landscape, which it states has grown 224% since the start of 2024. The report identifies several key trends driving this expansion. According to…
Share
BitcoinEthereumNews2025/09/18 00:40
Slumps as Yen gains on risk aversion

Slumps as Yen gains on risk aversion

The post Slumps as Yen gains on risk aversion appeared on BitcoinEthereumNews.com. The GBP/JPY register losses of 0.20& on Wednesday as investors wait for the Bank
Share
BitcoinEthereumNews2026/03/19 07:37