Bitcoin Drops Below $95,000 as Fear & Greed Index Hits Lowest Level Since February
Bitcoin market sentiment has reached its weakest level in nine months. The Fear & Greed Index now sits at 10, marking extreme fear among investors. This drop signals growing pessimism across the cryptocurrency market.
The leading digital asset has fallen below critical technical levels. Both the 7-day and 30-day moving averages now sit above the current price. This pattern indicates deteriorating momentum across short and medium timeframes.
Bitcoin has declined 9.81% over the past week. The price dropped beneath the psychologically important $100,000 threshold. At the time of writing, Bitcoin is trading at around $94,211. Large-scale holders have accelerated their selling activity. These ”whales” control substantial portions of the circulating supply. Their distribution pattern has intensified downward pressure.
BTC weekly price action (Source: CoinMarketCap)
Institutional Interest Weakens Amid Tech Correlation
U.S. spot Bitcoin exchange-traded funds recorded notable outflows. These vehicles offer institutional investors regulated exposure to cryptocurrencies. Declining inflows suggest professional money managers are reducing positions.
The digital asset maintains a negative correlation with the Nasdaq 100 index. This relationship creates asymmetric risk during periods of volatility in the technology sector. Bitcoin tends to fall more sharply when tech stocks decline than it rises during tech rallies. Recent technology sector weakness has amplified cryptocurrency losses.
Analytics platform Santiment recorded a four-month peak in Bitcoin discussions on Friday. This spike occurred as the price dropped below $95,000. The surge in conversation volume reflects widespread uncertainty among retail participants. Fear, uncertainty, and doubt dominate social channels and trading forums.
Death Cross Formation Sparks Technical Debate
A new death cross has formed on Bitcoin's chart. This occurs when a short-term moving average crosses below a longer-term average. The pattern traditionally signals bearish momentum.
Analyst Benjamin Cowen notes these formations often coincide with local market lows. Previous death crosses marked short-term bottom formations. However, he emphasizes that the pattern functions as a lagging indicator. It confirms trends already underway rather than predicting future movements.
Cowen outlined two potential scenarios for the coming weeks. If the current market cycle remains intact, a bounce should materialize soon. Price action over the next seven days will prove critical. Evidence of support and accumulation would suggest buyers remain engaged.
The alternative scenario involves continued weakness. If no rebound develops, further downside becomes likely. The price would eventually gravitate toward the 200-day moving average. This level represents a longer-term trend gauge. A rally to that average could form a macro lower high. This development would mark a significant structural shift in the market cycle.


You May Also Like
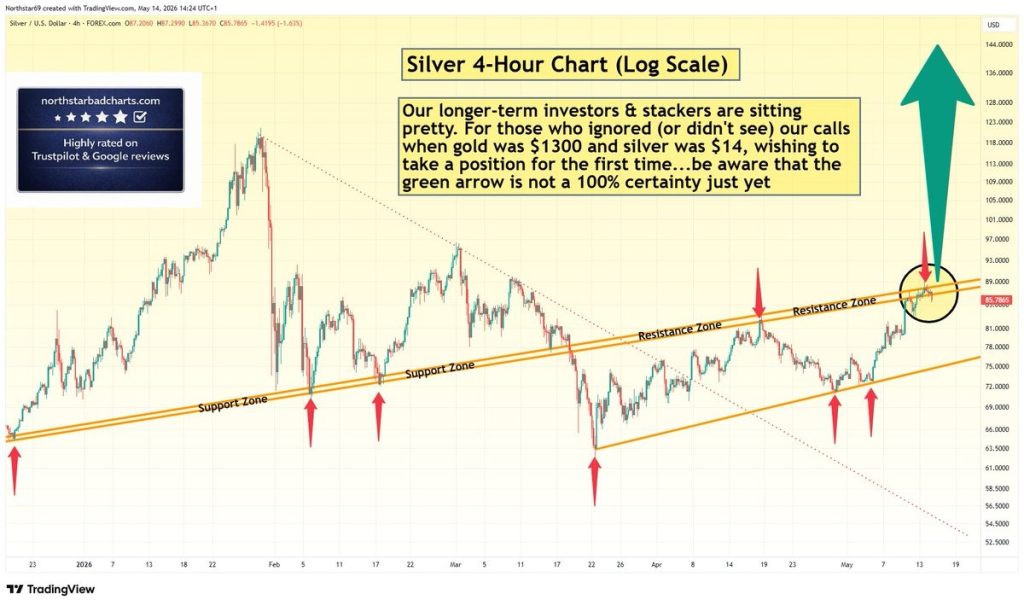
Silver Price Warning: Green Arrow Setup Is Not Confirmed – Wait for Clear Signal

Facebook spotlights African cinema in 6th ‘Made by Africa, loved by the world’ campaign