

Bitcoin Falls to $93,000 as Crypto Sentiment Plunges to Extreme Fear

- Bitcoin dropped sharply to $93,000, erasing 2025 gains and pushing the Fear & Greed Index to 14.
- The crash triggered $510 million in liquidations, hitting long contracts hardest across major crypto assets.
- Analysts highlight key support zones at $94,100, $93,500, and $89,000–$91,000 for potential short-term stabilization.
Bitcoin (BTC) began this week with extreme market volatility, plummeting to $93,000 on Monday morning in Asia but recovering shortly after. The sharp fall triggered liquidations amounting to $510 million within 24 hours, erasing any gains that Bitcoin had achieved in 2025 so far. The sharp fall has moved the Fear & Greed Index to 14, indicating extreme fear is evident in this market.
Bitcoin Faces Deepening Market Fear
The recent correction erased almost 24% of Bitcoin’s value from its peak in early October at $126,000. The fall to $93,000 posed both psychological and technical losses to the coin, thus eradicating its year-to-date gain.
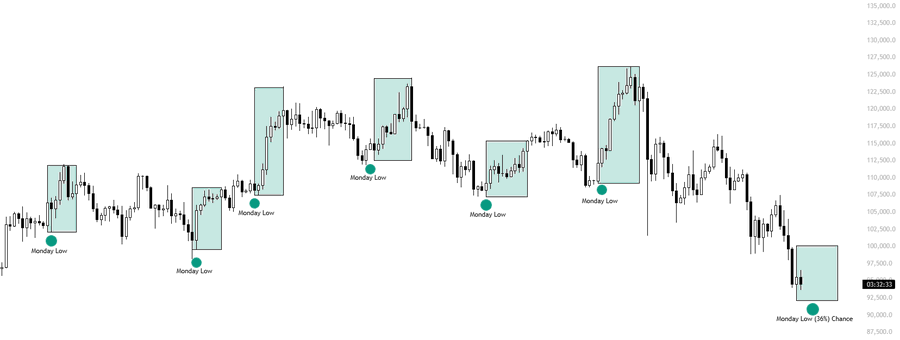
Market dynamics also saw a change. While there was a trend of strength during the weekend, Bitcoin saw a sharp decline instead, which formed what analyst KillaXBT described as a bearish pattern before Monday. Using market dynamics on 300 days of market prices, KillaXBT said there is a 36% probability that a short-term bottom could be formed on Monday.
 Source: X
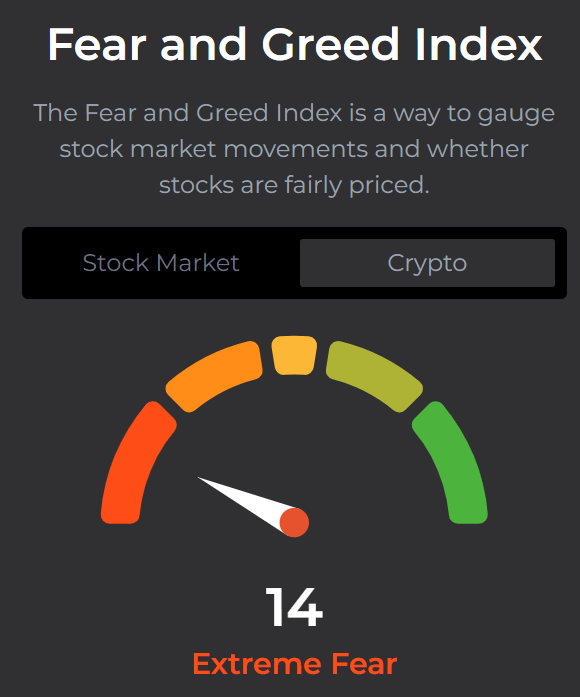
The price decrease occurred simultaneously with a sharp decrease in market sentiment. The Fear & Greed Index plummeted to 14, having reached late 2024’s peaks at 93 when market sentiment reached its highest level.
 Source: feargreedmeter.com
Crypto Liquidations Surge After Crash
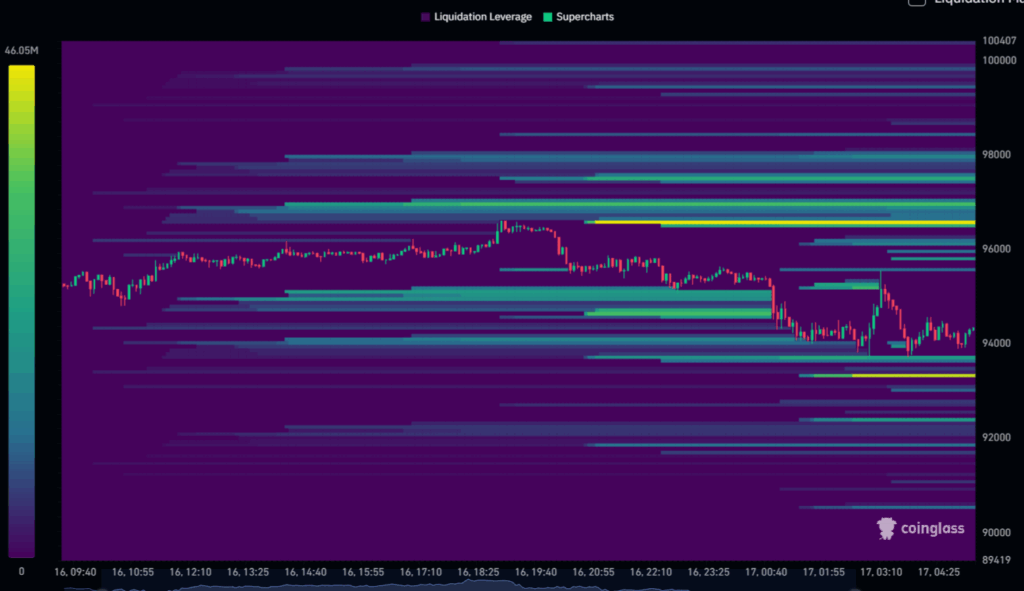
The rapid fall triggered a wave of forced unwinds across derivative markets. A market participant base topping 150,000 accounts was liquidated, with a total value exceeding $510 million.
Long contracts experienced the steepest decline during this sharp market crash, resulting in a loss of $40.37 million within one hour and $77 million within four hours. The value of Bitcoin contracts amounting to $41.61 million triggered long liquidation.
 Source: Coinglass
While other prominent assets such as Solana, XRP, and Dogecoin suffered similar losses due to market movement aligned with Bitcoin. Ethereum contracts amounting to $13.99 million also underwent long liquidation.
Also Read | Bitcoin (BTC) Drops to $104,000 as CME Gap Finally Closes: What’s Next?
Bitcoin Tests Crucial Support Levels
As KillaXBT believes, what Bitcoin will do next is entirely dependent on market behavior around specific strong support points. The analyst identified $94,100 as the first level to retrace to, and after that is $93,500, which is identified as the market opening value at 2025. Subsequent to these points is a specific level identified within the $89,000-$91,000 range, which shows strong market activity.
These zones have consistently shown strong participation, making them crucial to keep track of. However, leverage should not be high during this level of market volatility. However, the analyst warned that with recent market swings of 4–5%, overexposed trade is very vulnerable.
A break strongly below $85,000 could mark a change in momentum. However, if support is maintained and market liquidity improves, a rally to $100,000 could be likely, though resistance is likely to arrive around $98,300.
Also Read | Bitcoin Price Outlook: $100K–$108K Range Signals Potential Bottom


You May Also Like

Teacher accuses MAGA superintendent of working with Libs of TikTok to destroy his career
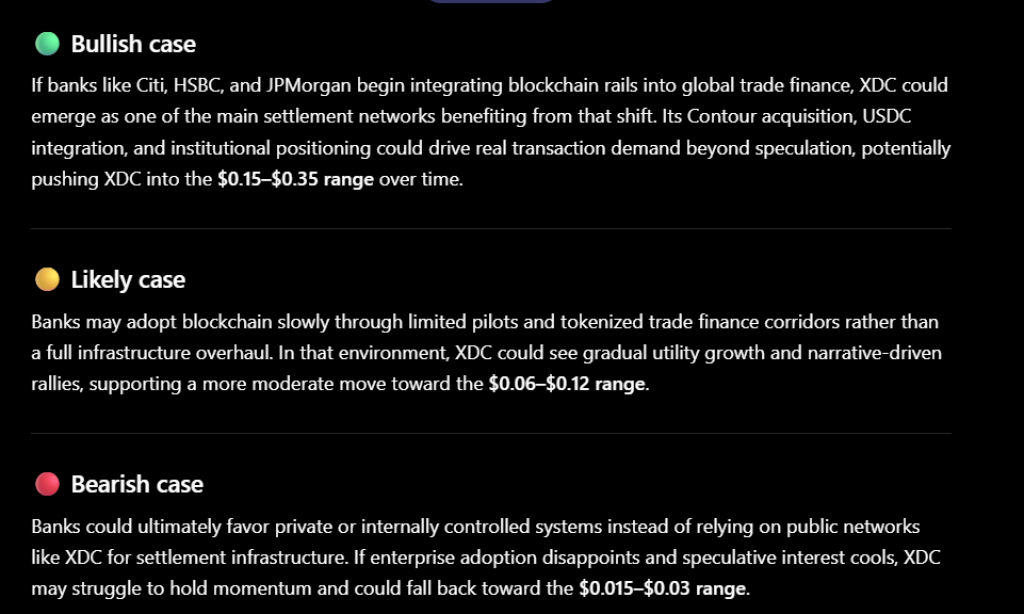
ChatGPT Predicts XDC Network Price if Banks Finally Upgrade the “Plumbing” Behind Global Trade Finance


