Solana (SOL) has recently demonstrated signs of price recovery, with key indicators showing that $130 is a reliable support zone. Over the last 24 hours, SOL price has surged over 5% to $140, forming a V-shaped recovery pattern.  This recovery follows a 20% drop from $173 in the past week, which hints at a revival […]Solana (SOL) has recently demonstrated signs of price recovery, with key indicators showing that $130 is a reliable support zone. Over the last 24 hours, SOL price has surged over 5% to $140, forming a V-shaped recovery pattern.  This recovery follows a 20% drop from $173 in the past week, which hints at a revival […]

Solana Price: Can the Rebound from $130 Trigger a Move Toward $250?

2025/11/19 20:09
3 min read
For feedback or concerns regarding this content, please contact us at [email protected]
solana
  • Solana price rises to near $140 from a weekly low, hinting at a potential rebound.
  • Institutional demand for Solana ETFs attracts nearly $421 million in inflows.
  • SOL’s rising open interest and active addresses show growing activity amid volatility.

Solana (SOL) has recently demonstrated signs of price recovery, with key indicators showing that $130 is a reliable support zone. Over the last 24 hours, SOL price has surged over 5% to $140, forming a V-shaped recovery pattern. 

This recovery follows a 20% drop from $173 in the past week, which hints at a revival of buyer interest despite crypto market volatility. The relative strength index (RSI) has also risen from below 30 to over 50 indicating that upward momentum is increasing.
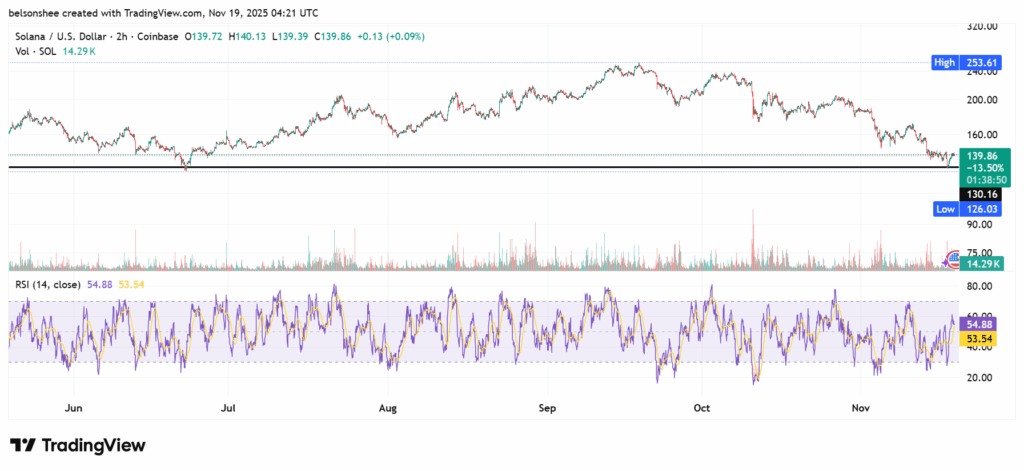
Source: TradingView

Furthermore, according to historical price movements, a possible rebound could set the stage for a price rally toward $200 or beyond.

$130 Support Level as a Strong Base for Solana Price

Solana price movement formed a base level of support near its low of $130. Historical price data indicate that SOL has repeatedly found strong support at the $130 level, with past rallies after bottoming near the support level leading to significant price increases.

According to price history, in late 2024, the price jumped by 108% to reach $260 from a low of $130. Similarly, between April and September this year, SOL surged to $250 from the same support zone.

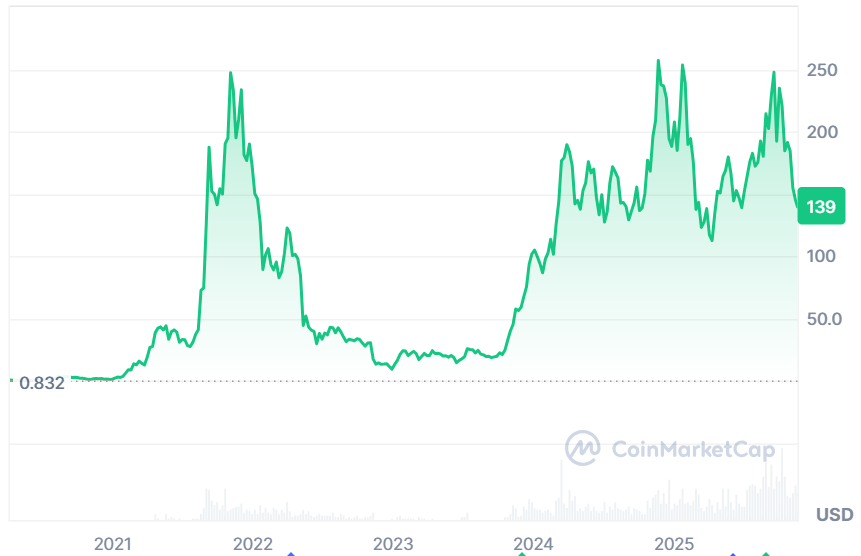
Source: CoinMarketCap

If history repeats, SOL price may experience a similar recovery, potentially rising to $250 price levels, which is an 80% increase from its current price near $141.

Increased ETF Inflows Boost Solana’s Price Recovery

Institutional demand may also fuel Solana price movement. Large investors are showing interest following the launch of Solana exchange-traded funds (ETFs). According to data, since launch, Solana ETFs have attracted $421 million in inflows, with the total amount of assets in these funds reaching $593 million. 
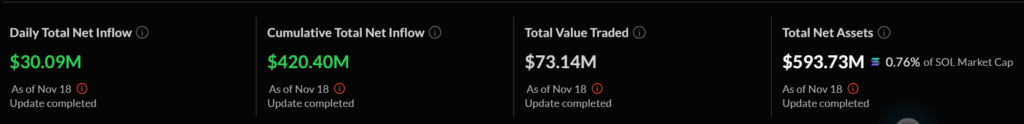
Source: Sosovalue

The surging inflows into ETFs reflect demand and confidence in SOL’s long-term potential, which adds to indicators of an upward price recovery. In addition, VanEck launched its ETF, VSOL, on November 17, with other asset managers like Fidelity and Canary following with their own SOL ETFs on November 18.

Also Read |  SOL’s Big Break: Institutional Investors Get Regulated Access to 15% Yield

Futures Market Activity Suggests Rising Buyer Interest

Alongside ETF inflows, data from CoinGlass indicates that open interest in Solana’s futures market has surged to $7,27 billion over the last 24 hours. This rise in open interest or positive funding rates in the futures market indicates increased buyer interest in SOL, which adds to the bullish view for the cryptocurrency.
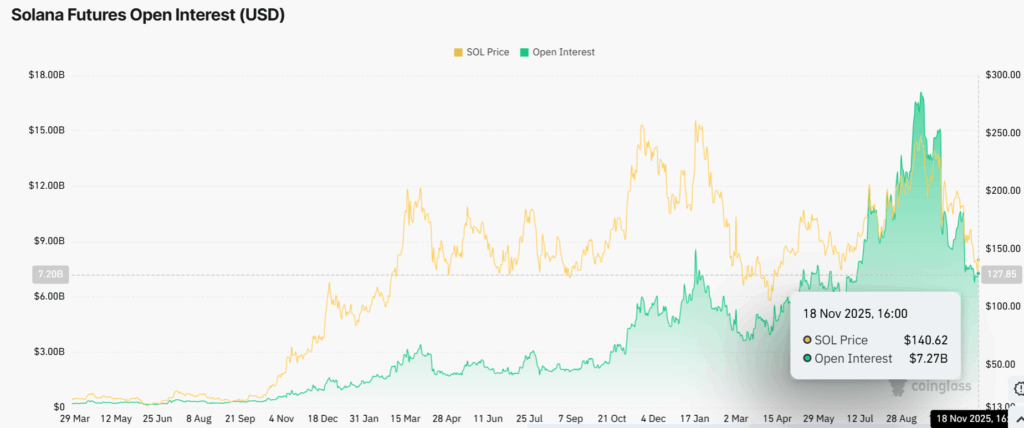
Source: CoinGlass

Furthermore, according to Nansen, the number of Solana active addresses increased by 18% over the last 30 days while the number of daily transactions rose by 10%. These on-chain metrics, in addition to SOL’s dominance in DApp revenue, indicate a long-term growth potential for SOL price.

Also Read | Solana Surges To The Top As The No. 1 Blockchain In DEX Activity

Market Opportunity
Movement Logo
Movement Price(MOVE)
$0.02086
$0.02086$0.02086
+1.65%
USD
Movement (MOVE) Live Price Chart
Disclaimer: The articles reposted on this site are sourced from public platforms and are provided for informational purposes only. They do not necessarily reflect the views of MEXC. All rights remain with the original authors. If you believe any content infringes on third-party rights, please contact [email protected] for removal. MEXC makes no guarantees regarding the accuracy, completeness, or timeliness of the content and is not responsible for any actions taken based on the information provided. The content does not constitute financial, legal, or other professional advice, nor should it be considered a recommendation or endorsement by MEXC.

You May Also Like

Polygon Tops RWA Rankings With $1.1B in Tokenized Assets

Polygon Tops RWA Rankings With $1.1B in Tokenized Assets

The post Polygon Tops RWA Rankings With $1.1B in Tokenized Assets appeared on BitcoinEthereumNews.com. Key Notes A new report from Dune and RWA.xyz highlights Polygon’s role in the growing RWA sector. Polygon PoS currently holds $1.13 billion in RWA Total Value Locked (TVL) across 269 assets. The network holds a 62% market share of tokenized global bonds, driven by European money market funds. The Polygon POL $0.25 24h volatility: 1.4% Market cap: $2.64 B Vol. 24h: $106.17 M network is securing a significant position in the rapidly growing tokenization space, now holding over $1.13 billion in total value locked (TVL) from Real World Assets (RWAs). This development comes as the network continues to evolve, recently deploying its major “Rio” upgrade on the Amoy testnet to enhance future scaling capabilities. This information comes from a new joint report on the state of the RWA market published on Sept. 17 by blockchain analytics firm Dune and data platform RWA.xyz. The focus on RWAs is intensifying across the industry, coinciding with events like the ongoing Real-World Asset Summit in New York. Sandeep Nailwal, CEO of the Polygon Foundation, highlighted the findings via a post on X, noting that the TVL is spread across 269 assets and 2,900 holders on the Polygon PoS chain. The Dune and https://t.co/W6WSFlHoQF report on RWA is out and it shows that RWA is happening on Polygon. Here are a few highlights: – Leading in Global Bonds: Polygon holds 62% share of tokenized global bonds (driven by Spiko’s euro MMF and Cashlink euro issues) – Spiko U.S.… — Sandeep | CEO, Polygon Foundation (※,※) (@sandeepnailwal) September 17, 2025 Key Trends From the 2025 RWA Report The joint publication, titled “RWA REPORT 2025,” offers a comprehensive look into the tokenized asset landscape, which it states has grown 224% since the start of 2024. The report identifies several key trends driving this expansion. According to…
Share
BitcoinEthereumNews2025/09/18 00:40
World Gold Council’s Pivotal Framework Promises Unprecedented Market Trust

World Gold Council’s Pivotal Framework Promises Unprecedented Market Trust

The post World Gold Council’s Pivotal Framework Promises Unprecedented Market Trust appeared on BitcoinEthereumNews.com. Tokenized Gold Revolution: World Gold Council
Share
BitcoinEthereumNews2026/03/20 03:58
Shiba Inu Price Prediction 2026: SHIB Fights to Reclaim Its Glory While Pepeto Offers the 150x Early Window That SHIB Already Closed

Shiba Inu Price Prediction 2026: SHIB Fights to Reclaim Its Glory While Pepeto Offers the 150x Early Window That SHIB Already Closed

A truck driver put $650 into Shiba Inu in 2020 and quit his job after his bag grew to $1.7 million. Two brothers invested $7,900 during the COVID lockdowns and
Share
Blockonomi2026/03/20 04:32