

Stellar crypto outlook: can XLMUSDT stabilise after the drop?
 Interest around Stellar crypto is resurfacing as the market searches for direction in a difficult macro backdrop. In this piece, we look at how XLM/USDT is positioned now, and what the current technical structure suggests about the next decisive move.
 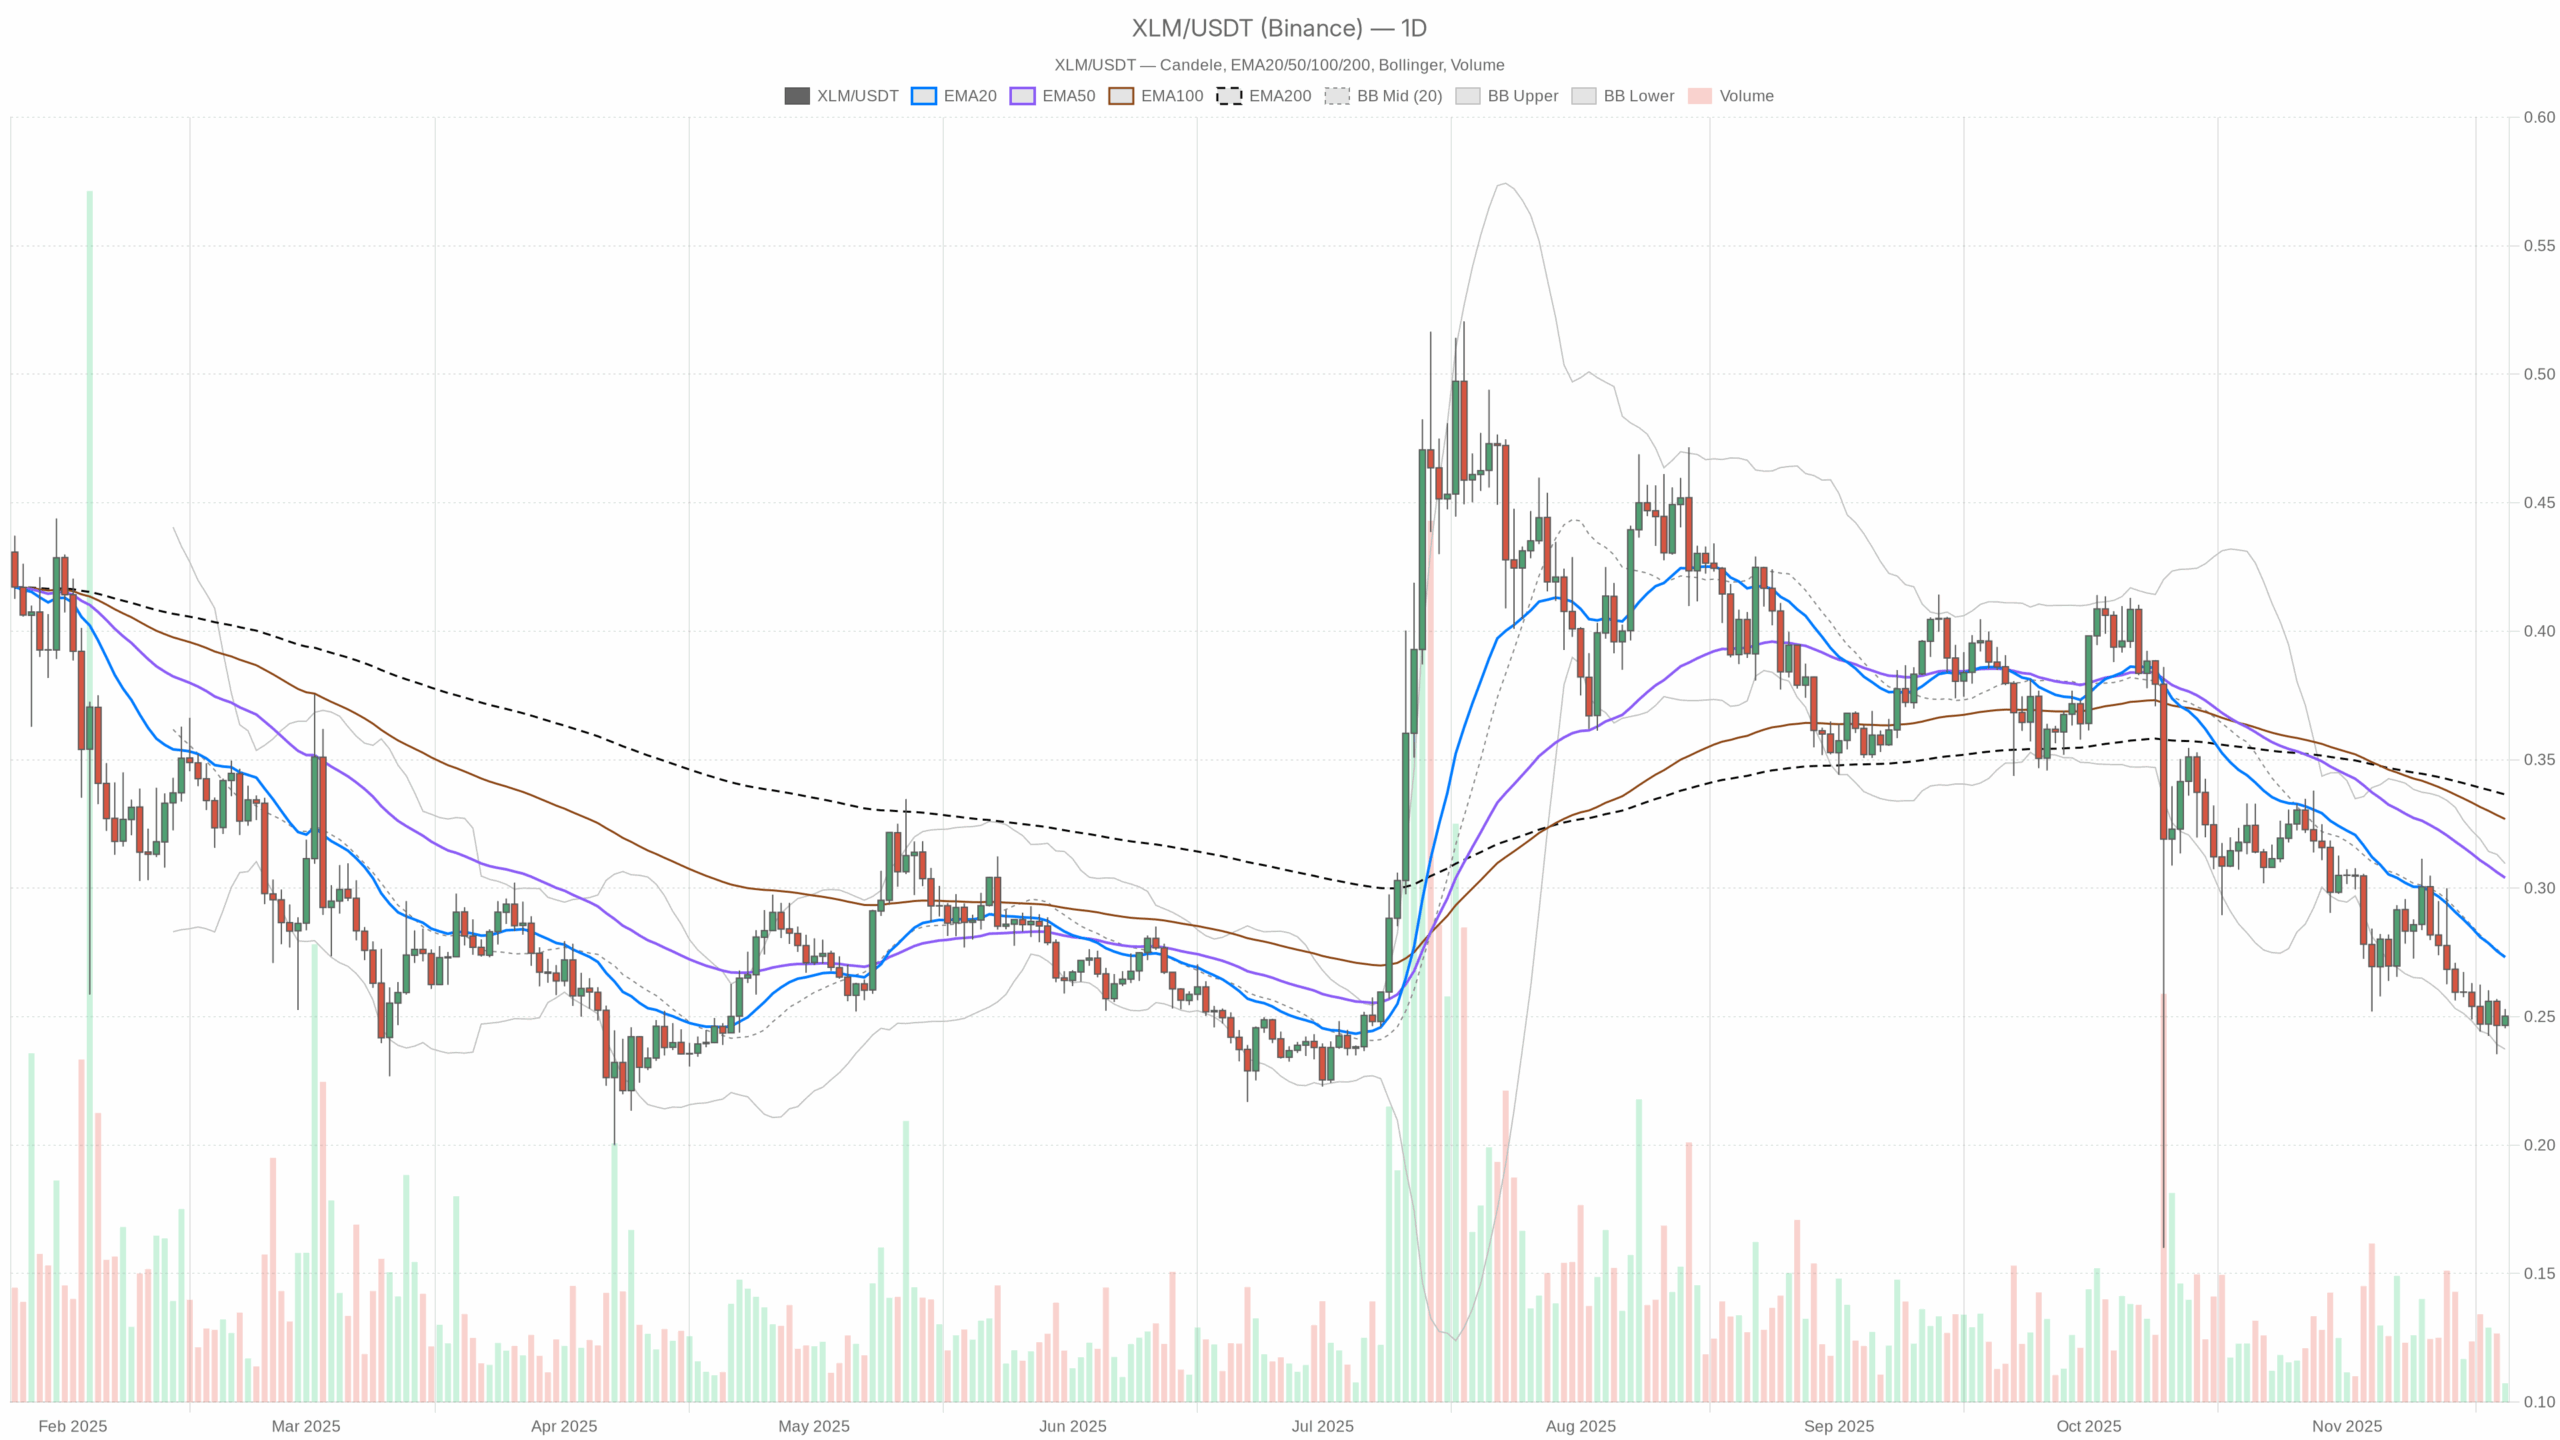 XLM/USDT — daily chart with candlesticks, EMA20/EMA50 and volume.
Summary
The daily chart shows a clear bearish regime, with the price at 0.25 USDT trading below all major moving averages. Momentum on the higher timeframe is weak, as the daily RSI lingers in the mid-30s, pointing to ongoing downside pressure but not yet a classic oversold flush. Moreover, MACD on the daily is flat and negative, reflecting a market where sellers have dominated but are no longer accelerating. Volatility has compressed modestly around the lower Bollinger Band, hinting at a potential inflection zone rather than a final capitulation. On intraday charts, however, conditions look more balanced, with neutral regimes and mid-range oscillators suggesting short-term traders are probing for a floor. Overall, sentiment is still fragile, but the setup is moving from aggressive selling to a more tactical, range-driven phase.
Stellar crypto: Market Context and Direction
The broader market environment is cautious, and that matters for XLMUSDT. Global crypto capitalization stands near 3.21 trillion dollars, with a small negative change over the past 24 hours, signalling consolidation after prior advances rather than a full-blown risk-off move. Meanwhile, Bitcoin commands about 57% of total market cap, a level that typically reflects a defensive bias as capital clusters around the benchmark rather than flowing into alternative assets.
At the same time, the Fear & Greed Index sits at 11, firmly in the zone of Extreme Fear. This backdrop usually coincides with forced selling, reduced risk appetite and a preference for liquidity over speculation. For XLMUSDT, that means the bar for a sustained upside reversal is higher, since any rally must fight not only its own technical headwinds but also a market where participants remain risk-averse. That said, such depressed sentiment can, over time, set the stage for contrarian opportunities once technicals start to confirm a shift.
Technical Outlook: reading the overall setup
On the daily timeframe, XLMUSDT trades at 0.25, clearly below the 20-day exponential moving average at 0.27, the 50-day at 0.30 and the 200-day at 0.34. This stacking of moving averages above price points to a well-established downtrend where rallies are more likely to be sold than extended. Until price can reclaim at least the 20-day EMA and hold above it, the path of least resistance remains to the downside or, at best, sideways under pressure.
The daily RSI at roughly 35.7 reinforces this picture. It signals that momentum is weak but not yet in the kind of extreme oversold territory that often sparks aggressive mean-reversion bounces. As a result, the indicator suggests a grinding selloff phase rather than a blow-off capitulation, where trend followers remain in control but without dramatic volatility spikes.
MACD on the daily chart tells a similar story. Both the MACD line and signal line sit around -0.02 with a flat histogram, indicating that downside momentum has slowed but has not yet reversed. This kind of flat, negative MACD often appears in late stages of a downtrend, where the market is transitioning from strong directional selling into a consolidation regime. A decisive bullish crossover with expanding histogram would be one of the first technical signs that sellers are finally losing dominance.
Bollinger Bands on the daily timeframe are centred near 0.27, with the upper band close to 0.31 and the lower band around 0.24. Price hovering near the lower band, yet not breaking sharply below it, suggests that the market is respecting support but still trading in a downside-biased range. If price starts to close back toward the middle band, it would indicate short-covering and a possible attempt to retest the moving averages overhead.
The ATR over 14 days, at about 0.02, points to contained volatility. This relatively low reading means that, despite the bearish structure, there is no current volatility expansion to signal panic or a major trend climax. Traders should therefore expect methodical, incremental moves rather than explosive swings, at least until ATR begins to tick higher.
Intraday Perspective and XLMUSDT token Momentum
On the hourly chart, XLMUSDT is also at 0.25, but here the 20- and 50-period EMAs converge around price, while the 200-period EMA sits slightly higher at 0.26. This alignment reflects a neutral short-term regime, where neither buyers nor sellers have a clear tactical edge. Meanwhile, the hourly RSI near 54 indicates mildly positive intraday momentum, a notable contrast to the weak daily reading.
MACD on the hourly timeframe is flat around zero with no meaningful histogram, mirroring the absence of strong intraday trend. As a result, short-term trading appears to be dominated by range strategies and liquidity provision rather than aggressive directional bets. The hourly Bollinger Bands, spanning roughly 0.24 to 0.26 with price near the middle, further support the idea of a balanced micro-structure in which dips and pops are quickly faded.
The 15-minute chart reinforces this calm picture. Price trades essentially on top of the 20-, 50- and 200-period EMAs, RSI sits close to 50, and MACD is neutral. This alignment between shorter intraday frames confirms that, even though the higher timeframe is bearish, day traders are currently treating the pair as a mean-reversion candidate rather than a momentum short.
Key Levels and Market Reactions
The daily pivot level around 0.25 has become a focal point, acting as a magnet for price action and reflecting a temporary equilibrium between buyers and sellers. With both the first support and first resistance clustered in the same neighbourhood, the market is effectively coiling around this level. A clear push below 0.24, near the lower Bollinger Band, would likely confirm that the downtrend remains intact and could open the door to another leg lower.
Conversely, a move back above 0.27, in line with the 20-day EMA and Bollinger midline, would be the first sign that buyers are challenging the current structure. If price can then attack the 0.300.31 region where the 50-day EMA and upper band converge, it would signal a more convincing trend-repair attempt. Until such a breakout occurs, rallies toward these zones should be viewed as potential areas where supply may re-emerge.
Future Scenarios and Investment Outlook
Overall, the technical setup for Stellar crypto tilts bearish on the daily chart, while intraday timeframes are neutral and range-bound. This combination often precedes either a continuation breakdown, where the higher timeframe prevails, or a gradual basing pattern that eventually flips the trend. Much will depend on whether broader market sentiment can recover from Extreme Fear and whether Bitcoin dominance begins to ease, allowing capital to rotate back toward alternative names.
For longer-term participants, patience is crucial. Waiting for clear signs of trend confirmation on the upside such as a sustained reclaim of the 20-day and 50-day EMAs with improving RSI and a positive MACD turn may offer a more favourable risk-reward profile than attempting to pick exact bottoms. Shorter-term traders, meanwhile, can work with the current range dynamics around 0.25, staying nimble and respecting volatility even if ATR remains subdued.
This analysis is for informational purposes only and does not constitute financial advice.
Readers should conduct their own research before making investment decisions.
You May Also Like

Russia’s Central Bank Prepares Crackdown on Crypto in New 2026–2028 Strategy

UK crypto holders brace for FCA’s expanded regulatory reach

