PEPE trades below key resistance at $0.0000059, confirming a bearish setup with weak indicators, falling open interest, and cooling demand.PEPE trades below key resistance at $0.0000059, confirming a bearish setup with weak indicators, falling open interest, and cooling demand.

PEPE’s 20% Weekly Crash Gets Worse as Crucial Support Breaks Down

PEPE is trading near $0.00000485 after falling through a key support level. The token is down over 17% on the week, as it dipped to multi-month lows.

Meanwhile, the move has drawn attention from traders watching whether a deeper drop is ahead or if a base is forming.

Key Level Break Signals Pressure

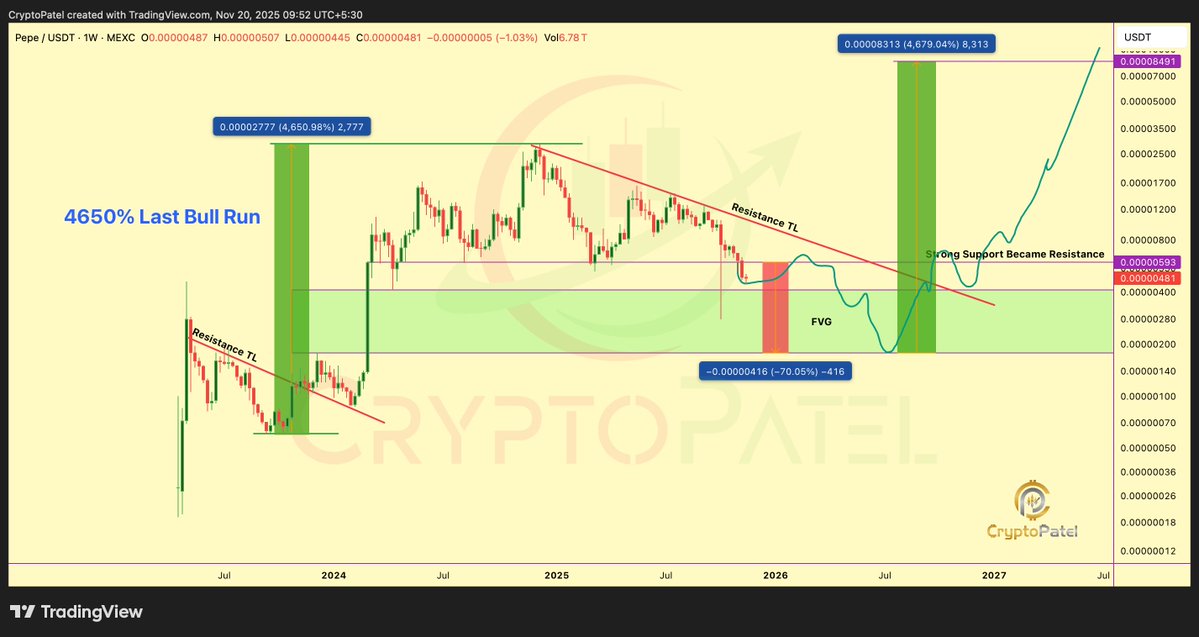
Analyst Crypto Patel noted that the $0.0000059 support has broken and is now acting as resistance. He describes this shift as a warning that the larger trend still favors sellers.

Patel also points to a weekly Fair Value Gap (FVG) that remains partially filled, along with a sweep of liquidity under multi-month lows. These conditions, according to his chart, suggest that further downside could take the price toward the $0.00000178 zone. He refers to this area as a likely point of interest for longer-term buyers.

PEPE price chartSource: Crypto Patel/X

Moreover, Patel’s chart compares the current setup to one seen before PEPE’s last major rally. In that case, the price broke down, consolidated, then launched into a sharp move higher. The previous breakout delivered gains of over 4,600%. He notes that the same setup could return, but only if the price dips into support and then reclaims lost ground. A move back above $0.0000059 would mark a shift in structure.

As CryptoPotato reported earlier this month, PEPE also broke below neckline support, confirming a head-and-shoulders pattern, aligning with the bearish structure.

Trend Remains Weak on Indicators

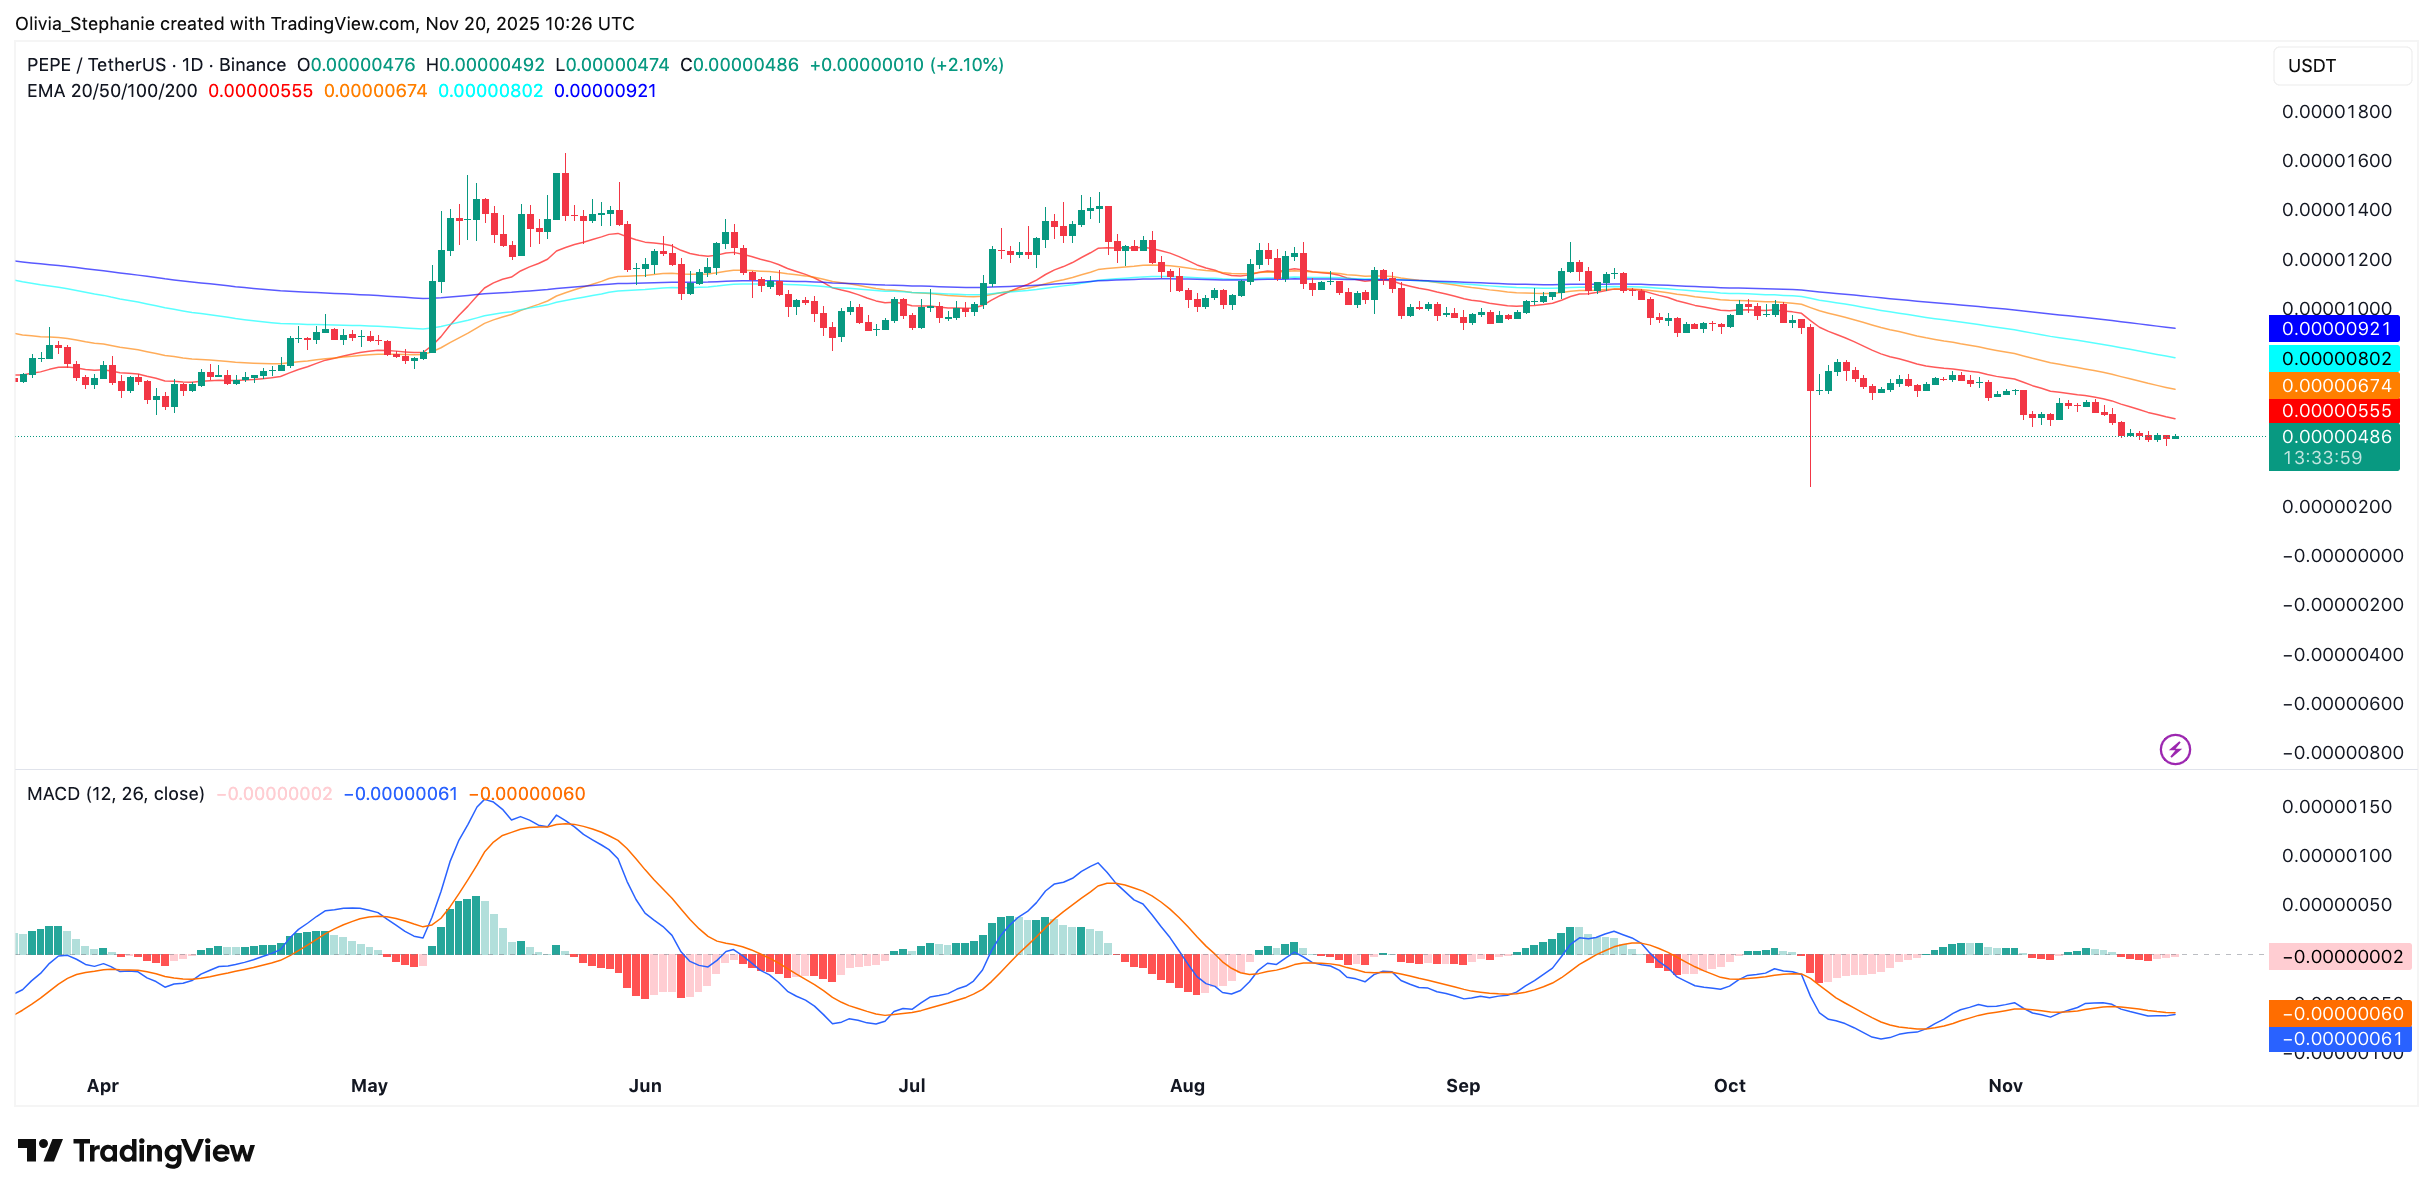
The price remains below the 20-, 50-, 100-, and 200-day exponential moving averages. All of these are trending lower. That signals weakness across the daily time frame. Unless PEPE can close above those levels, the bias stays to the downside.

PEPE price chartSource: TradingView

In addition, the MACD lines are still below the zero mark and moving sideways. There’s no sign yet of momentum turning. Volume and volatility also appear to be dropping, adding to the view that buyers are staying on the sidelines for now.

Speculation Drops as Interest Fades

Futures open interest has dropped to $193.5 million, down from over $1 billion in mid-2023, based on CoinGlass data. The sharp decline suggests fewer traders are using leverage. This can mean less volatility but also reflects a market that’s cooling off.

Spot exchange data supports the same view. Netflows have mostly been negative, showing that more tokens are leaving exchanges than coming in. This often points to holding behavior, but the steady drop in price shows demand hasn’t kept up. In recent weeks, both netflows and price action have flattened, signaling a pause in activity.

PEPE Spot Inflow/OutflowSource: CoinGlass

The post PEPE’s 20% Weekly Crash Gets Worse as Crucial Support Breaks Down appeared first on CryptoPotato.

Market Opportunity
Pepe Logo
Pepe Price(PEPE)
$0.000004683
$0.000004683$0.000004683
+10.00%
USD
Pepe (PEPE) Live Price Chart
Disclaimer: The articles reposted on this site are sourced from public platforms and are provided for informational purposes only. They do not necessarily reflect the views of MEXC. All rights remain with the original authors. If you believe any content infringes on third-party rights, please contact [email protected] for removal. MEXC makes no guarantees regarding the accuracy, completeness, or timeliness of the content and is not responsible for any actions taken based on the information provided. The content does not constitute financial, legal, or other professional advice, nor should it be considered a recommendation or endorsement by MEXC.

You May Also Like

The Battle for the Next 10x Return

The Battle for the Next 10x Return

The post The Battle for the Next 10x Return appeared on BitcoinEthereumNews.com. Crypto Projects As momentum continues rotating across the crypto market, a new
Share
BitcoinEthereumNews2026/01/02 01:59
OpenAI Audio AI Bets Big as Silicon Valley’s Revolutionary War on Screens Intensifies

OpenAI Audio AI Bets Big as Silicon Valley’s Revolutionary War on Screens Intensifies

BitcoinWorld OpenAI Audio AI Bets Big as Silicon Valley’s Revolutionary War on Screens Intensifies San Francisco, December 2024 – OpenAI is making a monumental
Share
bitcoinworld2026/01/02 02:45
Polygon Tops RWA Rankings With $1.1B in Tokenized Assets

Polygon Tops RWA Rankings With $1.1B in Tokenized Assets

The post Polygon Tops RWA Rankings With $1.1B in Tokenized Assets appeared on BitcoinEthereumNews.com. Key Notes A new report from Dune and RWA.xyz highlights Polygon’s role in the growing RWA sector. Polygon PoS currently holds $1.13 billion in RWA Total Value Locked (TVL) across 269 assets. The network holds a 62% market share of tokenized global bonds, driven by European money market funds. The Polygon POL $0.25 24h volatility: 1.4% Market cap: $2.64 B Vol. 24h: $106.17 M network is securing a significant position in the rapidly growing tokenization space, now holding over $1.13 billion in total value locked (TVL) from Real World Assets (RWAs). This development comes as the network continues to evolve, recently deploying its major “Rio” upgrade on the Amoy testnet to enhance future scaling capabilities. This information comes from a new joint report on the state of the RWA market published on Sept. 17 by blockchain analytics firm Dune and data platform RWA.xyz. The focus on RWAs is intensifying across the industry, coinciding with events like the ongoing Real-World Asset Summit in New York. Sandeep Nailwal, CEO of the Polygon Foundation, highlighted the findings via a post on X, noting that the TVL is spread across 269 assets and 2,900 holders on the Polygon PoS chain. The Dune and https://t.co/W6WSFlHoQF report on RWA is out and it shows that RWA is happening on Polygon. Here are a few highlights: – Leading in Global Bonds: Polygon holds 62% share of tokenized global bonds (driven by Spiko’s euro MMF and Cashlink euro issues) – Spiko U.S.… — Sandeep | CEO, Polygon Foundation (※,※) (@sandeepnailwal) September 17, 2025 Key Trends From the 2025 RWA Report The joint publication, titled “RWA REPORT 2025,” offers a comprehensive look into the tokenized asset landscape, which it states has grown 224% since the start of 2024. The report identifies several key trends driving this expansion. According to…
Share
BitcoinEthereumNews2025/09/18 00:40