

Tron crypto outlook: TRX under pressure but nearing a decision zone
 Tron crypto (TRX) is trading in a fragile spot, with its pairing against Tether showing clear signs of fatigue after a prolonged grind lower. However, the current setup also hints that sellers may be running into increasingly crowded territory, and readers will find here how the multi-timeframe structure frames the next moves.
 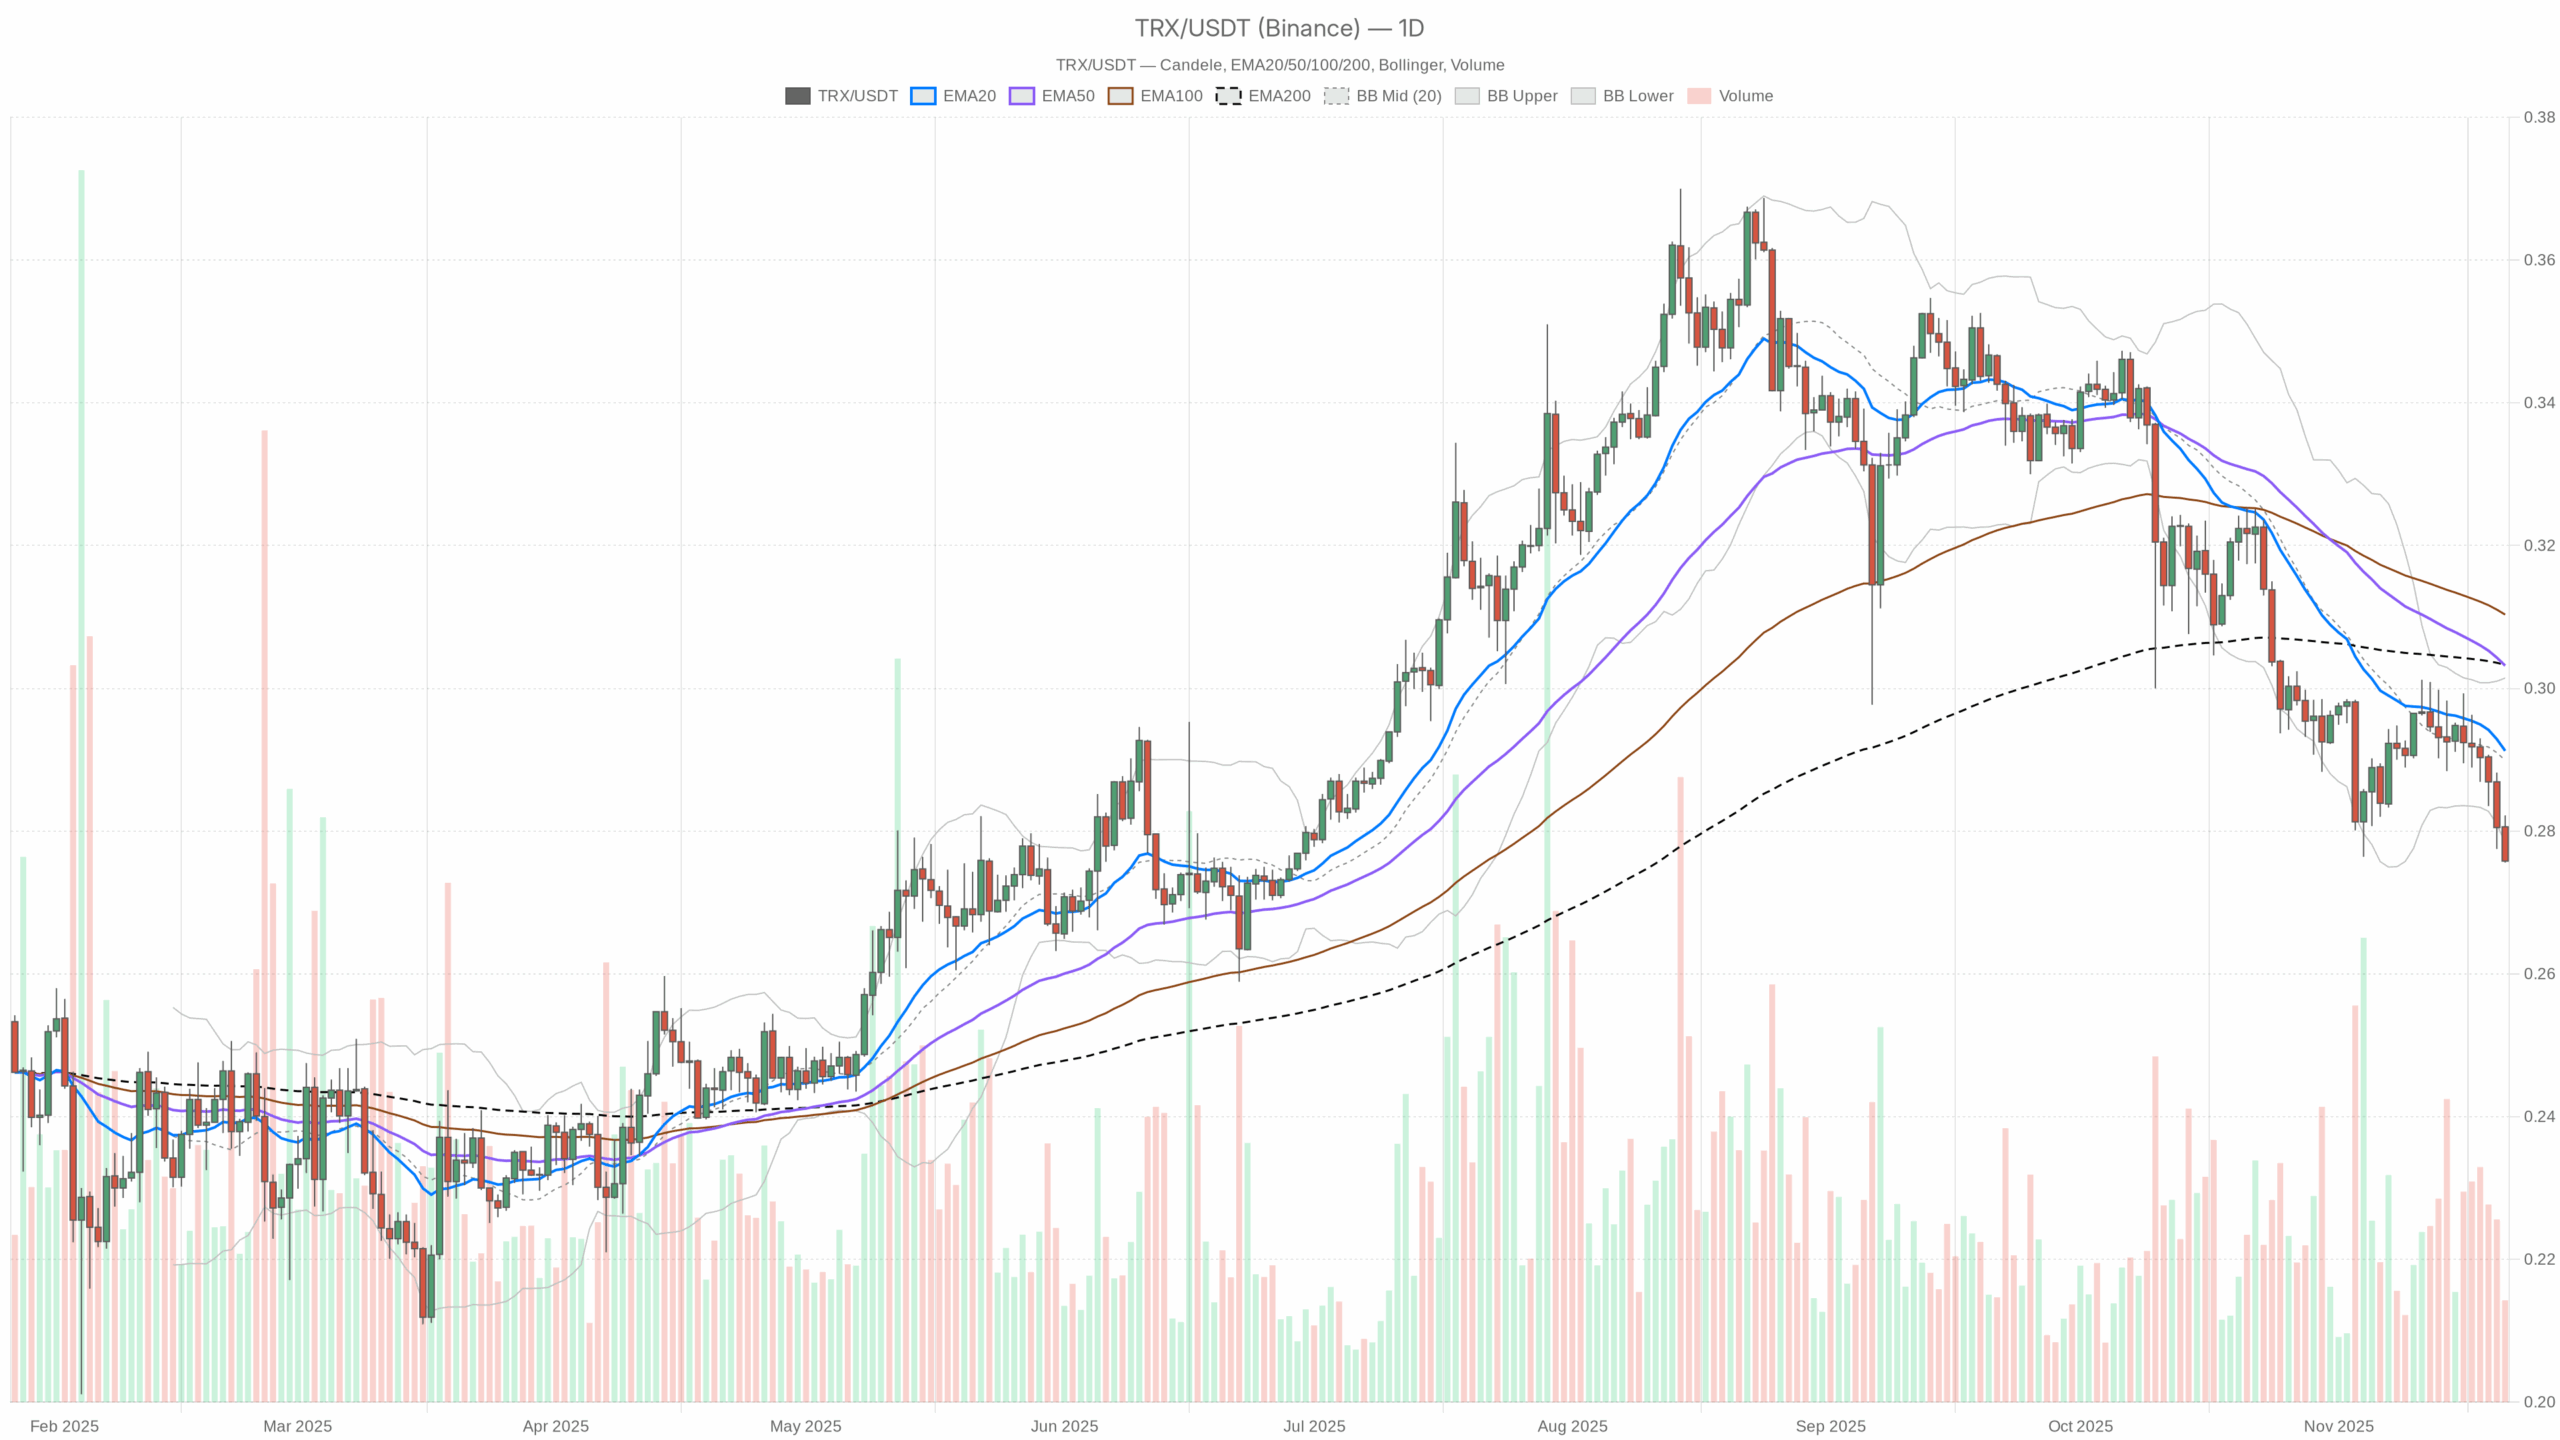 TRX/USDT — daily chart with candlesticks, EMA20/EMA50 and volume.
Summary
The asset is changing hands around 0.28 USDT, firmly below the daily 20, 50 and 200-day exponential moving averages. This alignment points to a dominant bearish trend on the higher timeframe. Daily RSI is stuck in oversold territory, while MACD remains negative but flat, indicating weak downside momentum rather than a sharp crash. Bollinger Bands on the daily chart are tight, showing muted volatility after the recent decline. Meanwhile, the broader crypto market is under pressure, with total capitalization near 2.97 trillion dollars and a sharp 24-hour drop above 8%. Sentiment confirms the stress: the Fear & Greed Index sits at 14, signaling extreme fear and risk aversion across the board.
Tron crypto: Market Context and Direction
The broader environment is an important backdrop for this asset. Total crypto market capitalization hovers around 2.97 trillion dollars, but it has fallen by more than 8% in the past 24 hours, framing a clear risk-off phase. Moreover, Bitcoin dominates roughly 56.6% of the market, which typically means capital is clustering in the most liquid and perceived “safer” coin rather than flowing down the risk curve to altcoins like TRX.
At the same time, the Fear & Greed Index at 14 underlines deep pessimism. In such conditions, investors often de-leverage and avoid fresh exposure to secondary names, which can prolong underperformance. That said, extreme fear has historically coincided with late stages of a sell-off rather than its beginning, opening the door to countertrend bounces once selling pressure eases. Against this macro backdrop, the token’s own daily structure leans negative but increasingly stretched.
Technical Outlook: reading the overall setup
On the daily chart, price at 0.28 trades below the 20-day EMA (0.29), the 50-day EMA (0.30) and the 200-day EMA (0.30). This full alignment of moving averages above price is a textbook sign of a mature downward trend, where rallies are more likely to be sold until the structure flattens. It tells us that, for now, medium and long-term participants remain positioned defensively.
Daily RSI at 29.33 sits just below the classic 30 threshold, marking oversold conditions. This suggests that downside momentum is stretched, and new short positions carry a higher risk of being late to the move. However, oversold does not automatically mean a reversal; it often signals a market that may pivot from sharp declines to slower, grinding behavior or short-lived bounces.
The MACD on the daily timeframe shows both the line and the signal around -0.01, with a histogram close to zero. This configuration implies that negative momentum exists but is losing intensity, hinting at a possible bearish momentum exhaustion phase. In practice, sellers are still in control, yet their pressure is no longer accelerating.
Bollinger Bands add an important layer. The middle band is near 0.29, with the upper band at 0.30 and the lower band close to 0.28, very near the current price. The narrow distance between bands indicates compressed volatility. When a market trends lower into a tight band structure, it often transitions into consolidation before the next significant directional move. ATR around 0.01 on the daily chart is consistent with this, confirming low average daily ranges and a market where sudden volatility expansion could surprise both sides.
Finally, the daily pivot point is clustered around 0.28, with a first support reference around 0.27. This proximity between the current price and the pivot suggests that the asset is trading directly in a decision zone for short-term sentiment. A clean break lower would validate continuation, while sustained trading above this area could mark the start of a base-building phase.
Intraday Perspective and TRXUSDT token Momentum
On the hourly timeframe, the picture echoes the daily weakness. Price is again at 0.28, with the 20 and 50-period EMAs also around 0.28 and the 200-period EMA slightly higher at 0.29. Meanwhile, the regime remains classified as bearish, meaning intraday traders are still operating within a short-term downtrend environment, even if the slope has flattened.
Hourly RSI sits at 29.05, showing that the market is also oversold on this shorter timeframe. As a result, immediate downside follow-through may struggle unless a new wave of selling emerges. MACD on the hourly chart is essentially flat at zero, which is consistent with the idea of intraday consolidation within a broader decline. The Bollinger Bands on this timeframe are tight around 0.28, and ATR is close to zero, underlining a period of low realized volatility where price is compressing rather than trending aggressively.
The 15-minute chart reinforces this message. The token trades near 0.28, with short, medium and long EMAs all converging at the same level, and the regime still marked bearish. RSI on this lower timeframe is particularly depressed at 20.5, which often signals a short-term capitulation zone for very tactical traders. This suggests that any additional intraday dip could quickly attract fast mean-reversion flows, even if it does not change the higher-timeframe story.
Key Levels and Market Reactions
A cluster of levels around 0.28 is clearly central. The daily pivot, multiple intraday pivots and several moving averages converge there, turning it into an immediate battleground. If buyers manage to keep the price above this area and push it back toward the mid-Bollinger region near 0.29, it would hint at a short-term relief bounce within the existing downtrend.
On the downside, the first notable support region lies near 0.27. A firm break and daily close below that zone would confirm that sellers remain dominant and could open the door to an extension of the bearish phase, with volatility likely expanding from today’s muted ranges. On the upside, the band between 0.29 and 0.30, where the 20, 50 and 200-day EMAs cluster, forms a heavier resistance area. Price acceptance above this zone would be needed to talk about a credible trend transition rather than a simple oversold bounce.
Future Scenarios and Investment Outlook
Overall, Tron crypto currently sits in a bearish but potentially overextended regime. Daily and intraday indicators agree on downside bias, yet both RSI and MACD hint that the most aggressive phase of selling could be fading. In such an environment, conservative investors might prefer to wait for evidence of a trend confirmation to the upside, such as sustained closes back above the 0.29–0.30 band and a rising daily RSI. More tactical traders, by contrast, may look for oversold bounces from the 0.27–0.28 area, while keeping tight risk controls given the fragile broader market.
In conclusion, the asset remains under pressure, but compressed volatility and stretched momentum suggest that the next significant move could be catalytic. Whether it turns into a deeper leg lower or a recovery attempt will likely depend on how price reacts around the current pivot zone and on any shift in wider crypto sentiment away from extreme fear.
This analysis is for informational purposes only and does not constitute financial advice.
Readers should conduct their own research before making investment decisions.


You May Also Like

Trump unhappy with latest peace proposal, says Iran ‘figuring out its leadership’

Australian Dollar underperforms as revived Mideast risks drag risker assets


