

Bitcoin news: sentiment, crash and what BTC traders watch next
 Bitcoin (BTC) is once again dominated by fear after a brutal washout that has pushed the market into one of its most fragile phases of 2025. In this piece we look at where BTCUSDT stands technically, how sentiment has shifted, and what levels could decide whether this turns into a deeper capitulation or the start of a long rebuilding phase.
 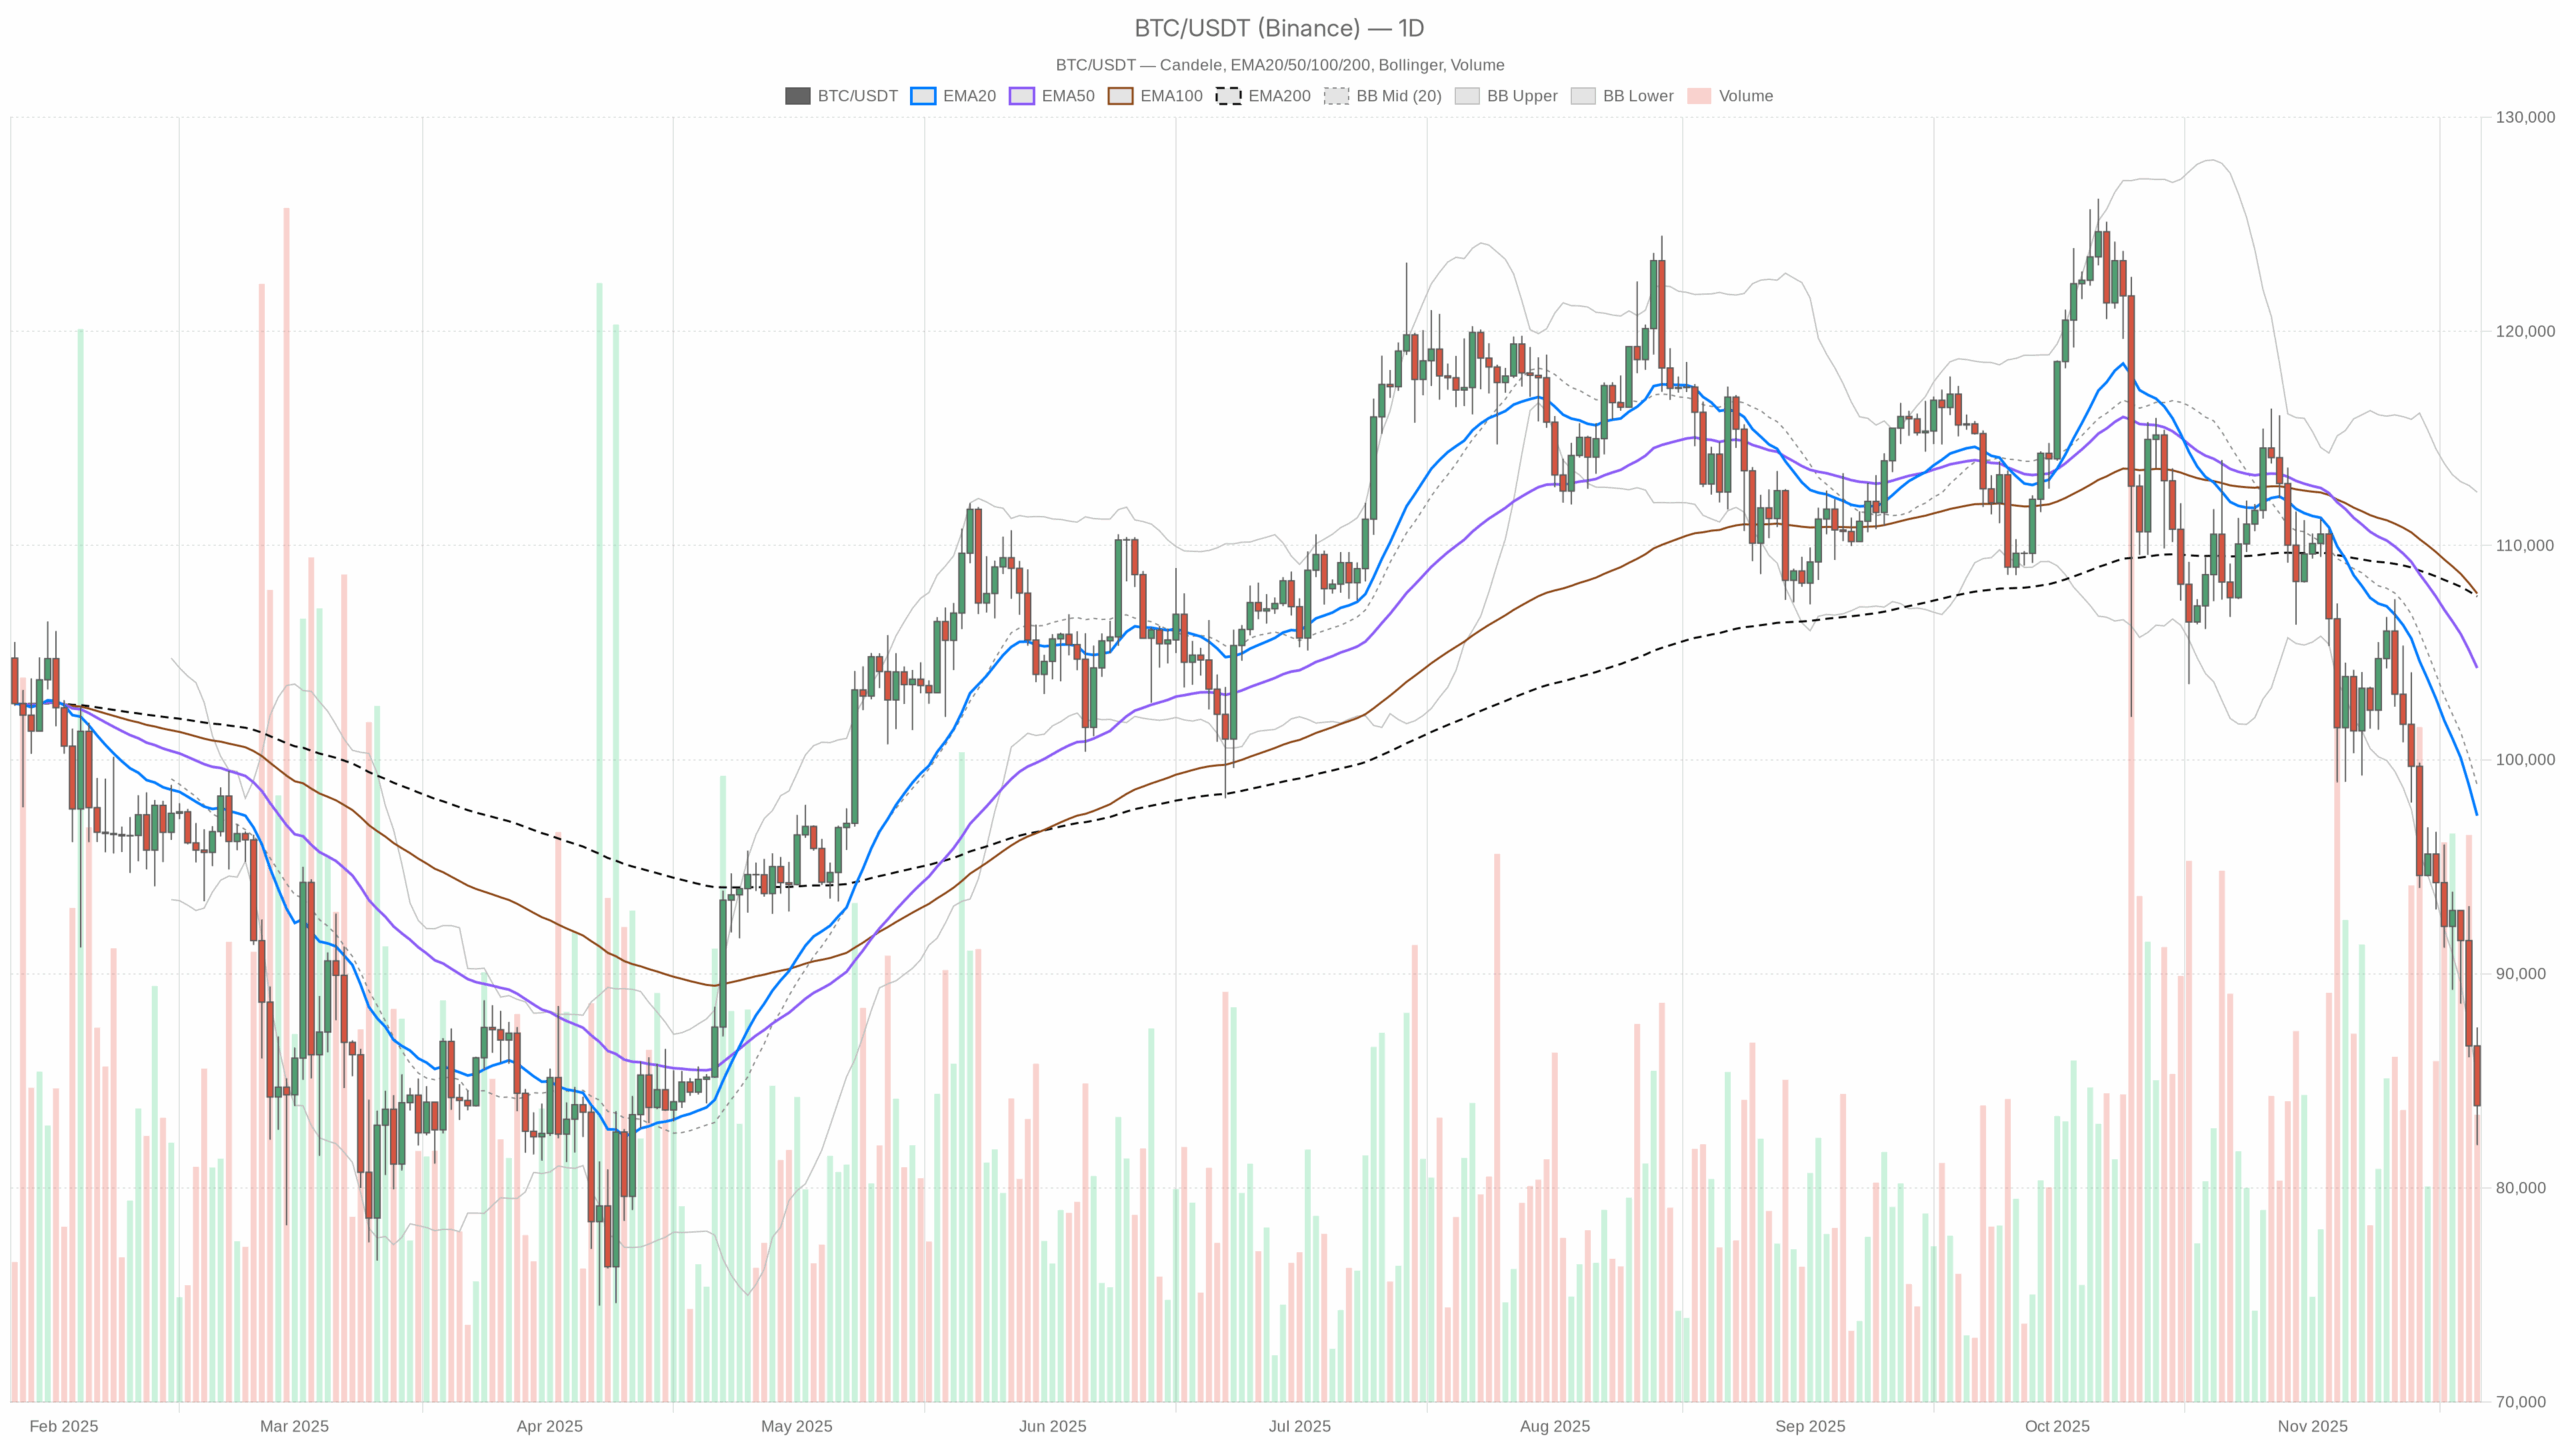 BTC/USDT — daily chart with candlesticks, EMA20/EMA50 and volume.
Summary
The dominant picture on the daily chart is clearly bearish, with price around 83,800 USDT and trading well below all key moving averages. Momentum indicators are deeply oversold, reflecting downside exhaustion but also confirming that sellers have been in firm control for weeks. Volatility remains elevated, although the Average True Range suggests it is not yet at a capitulation-style climax. Moreover, market-wide conditions are fragile, with total crypto capitalization near 2.97 trillion dollars and down about 8% over the last 24 hours. Bitcoin still commands roughly 56.6% of total market value, showing capital is retreating toward perceived safety even amid the selloff. The Fear & Greed Index at 14 signals extreme fear, which often coincides with late-cycle selling but can also precede violent bear market rallies.
Bitcoin news: Market Context and Direction
The latest headlines tell a clear story: BTC has dropped to a seven-month low, with Bloomberg highlighting how the 2025 crypto crash has erased around a trillion dollars in value. This is not just a routine correction; rather, it is a broad risk-off regime where leverage is flushing out and even long-term bulls are being tested. Moreover, coverage of a 600-billion-dollar slide and the temporary erasure of year-to-date gains underscores how quickly sentiment has swung from optimism to damage control.
In this backdrop, Bitcoin’s dominance near 56.6% is striking. When the overall market cap falls sharply but the leading asset strengthens its share, it usually means altcoins are suffering disproportionate losses. As a result, capital is consolidating around BTC as a relative safe haven within crypto, even as its own price bleeds lower. The broader market’s 8% daily contraction emphasizes the intensity of forced selling. Meanwhile, the Fear & Greed Index sitting at 14 confirms that participants are in a phase of panic-driven decision making, where capitulation and opportunity often coexist.
Technical Outlook: reading the overall setup
On the daily timeframe, BTCUSDT trades around 83,844, far beneath the 20-day exponential moving average at about 97,383, the 50-day near 104,284, and the 200-day around 107,626. This three-layer alignment above price illustrates a firmly established downtrend, as short-, medium-, and long-term baselines all slope against the bulls. Such a distance to the 200-day average also shows how far price has deviated from its longer-term equilibrium, leaving room both for continued pressure and for sharp mean-reversion rallies if sellers tire.
The daily RSI around 22 underlines a deeply oversold condition. Historically, readings this low reflect momentum exhaustion on the downside, where new shorts carry rising risk of a snapback squeeze. However, oversold does not automatically mean reversal; in strong bear phases, RSI can remain depressed while price grinds lower.
MACD on the daily chart reinforces the story. With the MACD line around -5,674 and the signal near -4,328, the negative histogram shows that downward momentum is still strong, but the spread between the two lines hints that the most violent phase of the move may be easing. That said, a convincing bullish momentum shift would require the histogram to contract consistently and, ultimately, a crossover back toward the zero line, which is not yet visible.
Bollinger Bands place the midline near 98,815 with the lower band around 85,139. Price is hovering just under this lower band, reflecting a market that has been pressing against volatility boundaries. This proximity often coincides with short-term volatility expansion and can mark areas where either capitulation spikes or initial bargain hunting emerges. The Average True Range near 4,442 shows wide daily ranges, consistent with liquidation-driven markets, yet it does not scream absolute panic, suggesting this could still evolve into a more protracted grind rather than a one-day crash.
Intraday Perspective and BTC Momentum
Shorter timeframes echo the daily weakness. On the hourly chart, BTCUSDT sits near 83,836, again below the 20-, 50-, and 200-period EMAs clustered between roughly 87,200 and 93,800. This layering confirms an intraday downtrend alignment, where rallies toward these moving averages are likely to encounter active sellers. Meanwhile, the hourly RSI around 27 shows intraday oversold conditions, but not as extreme as the daily, suggesting that short bounces may occur without changing the broader picture.
The hourly MACD remains negative with a slightly negative histogram, indicating that bearish momentum is still present but may be attempting to stabilize. On the 15-minute chart, the pattern repeats: price trades clearly below all key EMAs, RSI sinks near 20, and MACD stays firmly negative. As a result, the entire intraday structure is tilted toward trend continuation on the downside, with any rebound currently best described as a countertrend move within a larger bearish phase.
Key Levels and Market Reactions
Daily pivot levels offer a useful map for traders navigating this turbulence. The central pivot sits near 84,448, essentially where the market is attempting to stabilize. If price can reclaim and hold above this zone on closing bases, it would be an early hint that sellers are losing some grip. On the upside, the first notable resistance area lies around 86,900. Approaches to this band could attract renewed selling, as many recent longs trapped higher may use strength to reduce exposure.
On the downside, the first support area comes in near 81,400. A decisive break below this level, especially on rising ATR, would strengthen the case for another leg lower and a possible capitulation-style flush. Meanwhile, intraday pivots show a similar structure, with hourly resistance near 85,700 and support around 81,970, defining a short-term battlefield where scalpers and high-frequency traders will be most active.
Future Scenarios and Investment Outlook
Overall, the current wave of Bitcoin news reflects a market in distress but not necessarily at its final low. As long as BTCUSDT remains below its 20-day EMA and the daily MACD stays deeply negative, the primary scenario remains bearish, with rallies more likely to be sold than sustained. However, the combination of an RSI in the low 20s, price pressing the lower Bollinger Band, and extreme fear in sentiment creates conditions where a powerful relief rally can ignite quickly if selling pressure abates even slightly.
For short-term traders, this environment favors disciplined risk management: fade overextended bounces into resistance rather than buying breakdowns, and watch for any clear loss of downside momentum before considering aggressive long exposure. Longer-term investors may prefer to scale in gradually, accepting that volatility could remain high and that timing the exact bottom is unlikely. In both cases, respecting the current bearing market regime while remaining alert to signs of stabilization is key as the next chapter of this cycle unfolds.
This analysis is for informational purposes only and does not constitute financial advice.
Readers should conduct their own research before making investment decisions.
You May Also Like

IP Hits $11.75, HYPE Climbs to $55, BlockDAG Surpasses Both with $407M Presale Surge!

Whales Dump 200 Million XRP in Just 2 Weeks – Is XRP’s Price on the Verge of Collapse?

