

Polkadot price prediction 2026-2032: Will DOT recapture $20 soon?
Key takeaways
- In 2026, Polkadot might reach a maximum price value of $2.12 and an average value of $2.22.
- In 2029, the DOT price is expected to range from a maximum of $10.47 to a minimum of $7.71.
- The price of Polkadot is predicted to reach a maximum value of $20.82 in 2032.
Polkadot (DOT) is a next-generation blockchain network designed to connect and secure multiple blockchains, enabling them to share data and operate together seamlessly. Created by Ethereum co-founder Gavin Wood, Polkadot aims to solve key issues such as scalability, interoperability, and security through its unique multi-chain architecture. The network’s central relay chain coordinates specialized blockchains known as parachains, allowing transactions to be processed in parallel for greater efficiency. DOT, the native token, is used for network governance, staking to secure the ecosystem, and bonding to add new parachains, making it a core component of Polkadot’s growing Web3 infrastructure. Will DOT reach new heights soon? Let’s get into the Polkadot price prediction for 2026-2032.
Overview
| Cryptocurrency | Polkadot |
| Token | DOT |
| Price | $2.15 |
| Market Cap | $3.61B |
| Trading Volume | $233.27M |
| Circulating Supply | 1.65B DOT |
| All-time High | $55.00 Nov 4, 2021 |
| All-time Low | $2.69 Aug 19, 2020 |
| 24-hour High | $2.24 |
| 24-hour Low | $2.12 |
Polkadot price prediction: Technical analysis
| Volatility | 8.16% |
| 50-Day SMA | $ 2.12 |
| 14-Day RSI | 62.25 |
| Sentiment | Bearish |
| Fear & Greed Index | 42(Fear) |
| Green Days | 11/30 (37%) |
| 200-Day SMA | $ 3.47 |
Polkadot price analysis: DOT struggles near resistance despite stable demand at support
- $2.24 resistance continues to cap DOT’s upside, with repeated rejections limiting bullish momentum.
- Support at $2.12 remains firm, helping contain downside despite short-term weakness.
- DOT is consolidating near $2.15, signaling market indecision ahead of a breakout or breakdown.
As of 7 January 2026, Polkadot (DOT) is reported trading at $2.15, posting a 0.07% decline over the past 24 hours, based on the available price data. The asset has remained within a defined intraday range, with buyers holding firm near the $2.12 support level, while upward moves continue to encounter selling pressure around the $2.24 resistance zone.
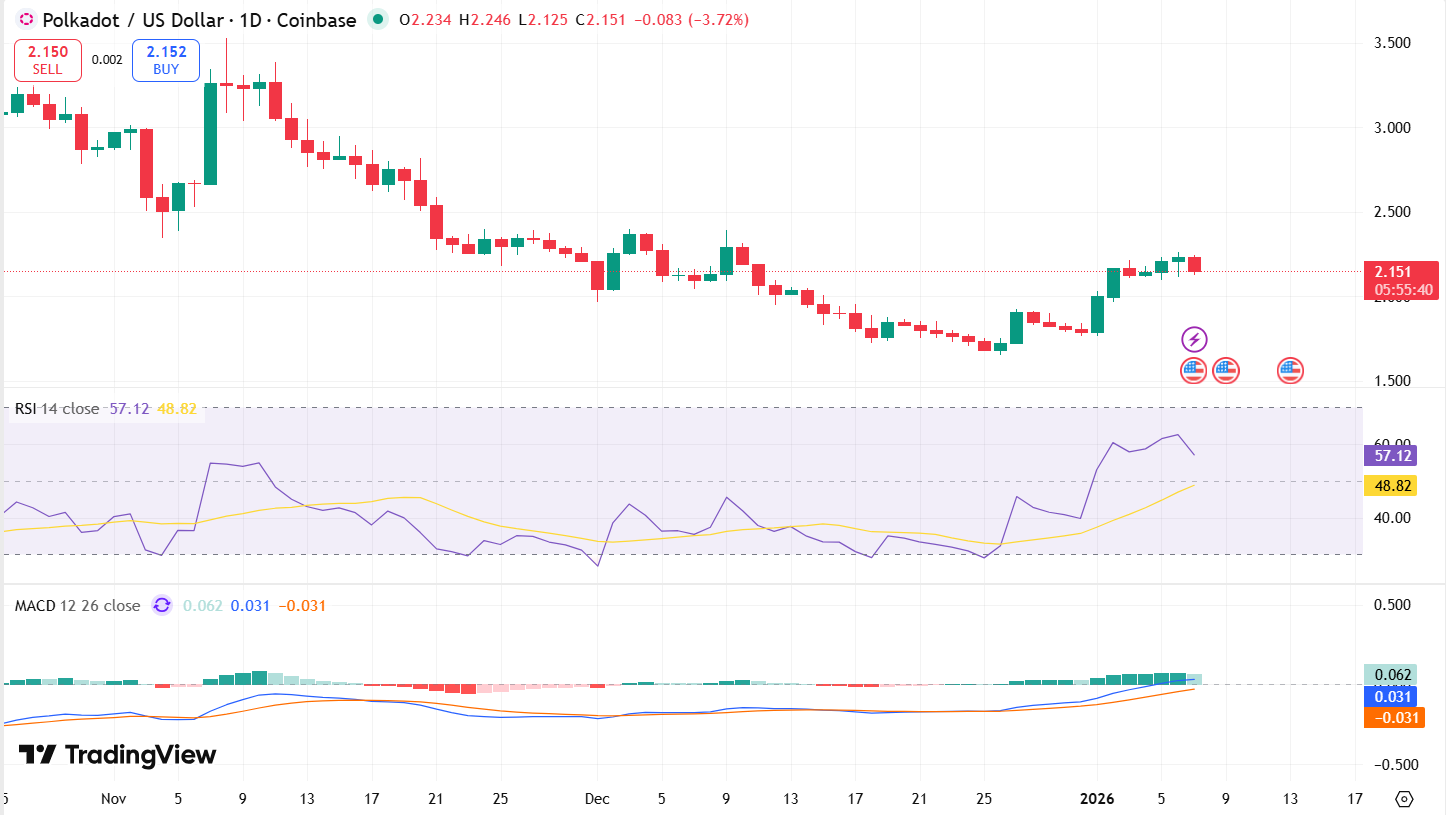
Polkadot 1-day price chart: DOT trades below resistance as momentum stalls
On the daily chart, DOT continues to trade beneath the $2.24 resistance, which has repeatedly limited upside progress. The session structure showed price failing to sustain higher highs, indicating that selling pressure remains dominant near the top of the recent range.
 DOT/USDT Chart: TradingView
Daily price behavior points to consolidation rather than trend continuation, with DOT holding above $2.12 support despite multiple pullbacks. The lack of a decisive breakdown suggested that downside pressure is controlled, while the failure to reclaim resistance confirmed that bullish momentum remains weak. This balance highlighted a market waiting for directional confirmation.
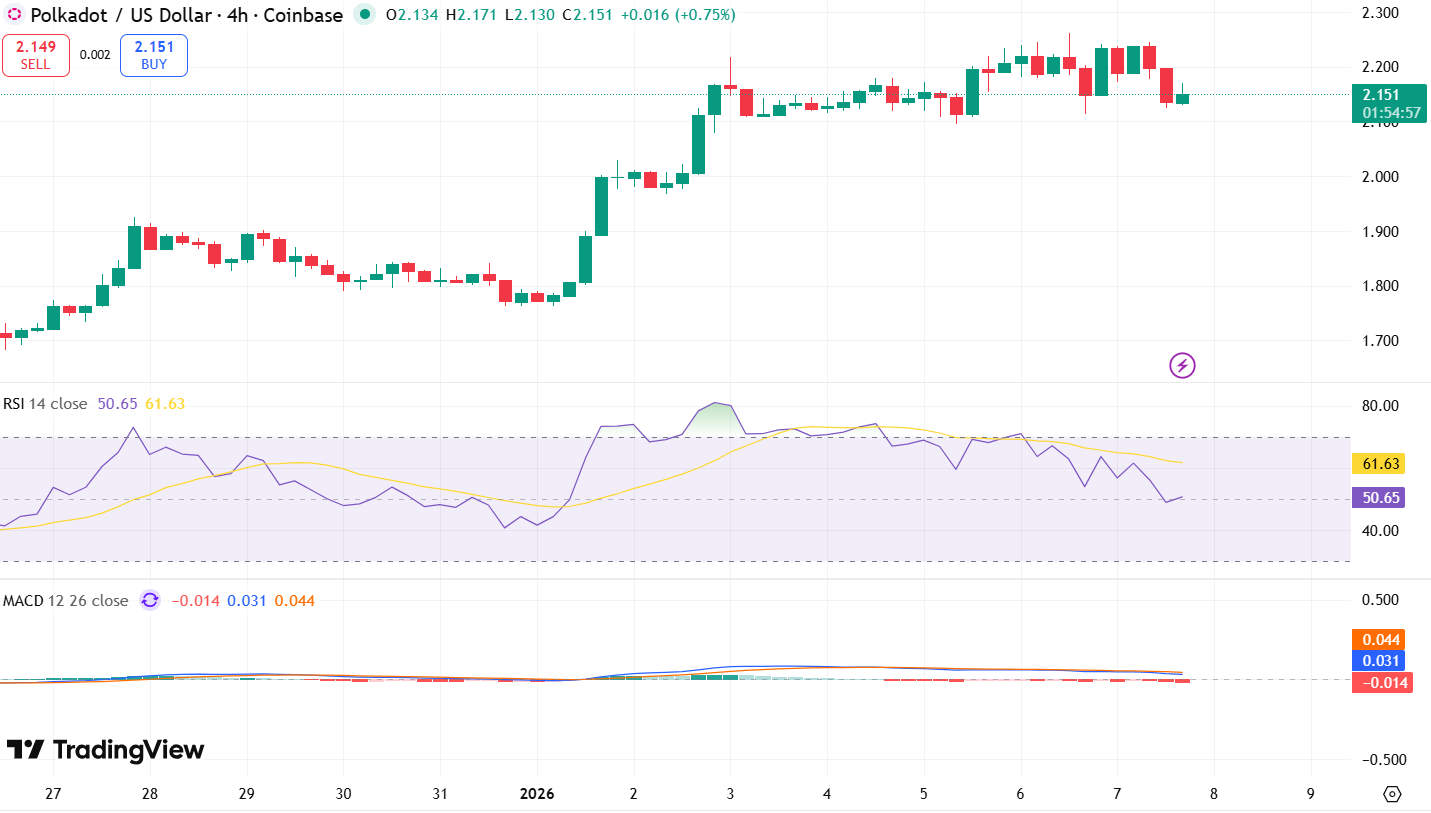
Polkadot 4-hour price chart: DOT short-term weakness persists within a tight range
On the 4-hour timeframe, DOT displays repeated rejections close to $2.24, reinforcing this level as a short-term supply zone. Each upward move lost strength quickly, signaling that sellers are actively defending higher prices.
 DOT/USDT Chart: TradingView
At the same time, the $2.12 support continues to hold on intraday dips, preventing accelerated losses. The structure on the 4-hour chart showed slowing momentum and shallow recoveries, pointing to distribution near resistance rather than accumulation. This setup reflected ongoing indecision, with price compressing around the $2.15 area as traders await a breakout or breakdown.
Polkadot technical indicators: Levels and action
Daily simple moving average (SMA)
| Period | Value ($) | Action |
| SMA 3 | $ 2.73 | SELL |
| SMA 5 | $ 2.60 | SELL |
| SMA 10 | $ 2.45 | SELL |
| SMA 21 | $ 2.46 | SELL |
| SMA 50 | $ 2.75 | SELL |
| SMA 100 | $ 3.35 | SELL |
| SMA 200 | $ 3.79 | SELL |
Daily exponential moving average (EMA)
| Period | Value ($) | Action |
| EMA 3 | $ 2.50 | SELL |
| EMA 5 | $ 2.73 | SELL |
| EMA 10 | $ 3.10 | SELL |
| EMA 21 | $ 3.45 | SELL |
| EMA 50 | $ 3.70 | SELL |
| EMA 100 | $ 3.86 | SELL |
| EMA 200 | $ 4.21 | SELL |
What can you expect next for Polkadot (DOT)?
Polkadot’s current consolidation near $2.15 suggests the market is at a crossroads. A sustained move above the $2.24 resistance could trigger renewed bullish momentum, potentially opening the path toward $2.30–$2.35 in the short term. Conversely, a decisive breakdown below the $2.12 support may signal further weakness, with DOT possibly testing $2.05 or lower.
Traders should watch volume closely, as breakout or breakdown scenarios will likely be confirmed by increased activity. Until a clear directional move occurs, DOT may continue oscillating within its current range, reflecting the tug-of-war between buyers defending support and sellers defending resistance.
Is Polkadot a good investment?
Polkadot (DOT) remains one of the prominent projects in the blockchain space, offering cross-chain interoperability and a scalable infrastructure for decentralized applications. Its innovative technology and active ecosystem make it appealing to long-term investors looking for exposure to the evolving Web3 landscape.
However, DOT’s near-term price action shows consolidation between $2.12 and $2.24, reflecting market indecision. This means short-term traders should be cautious, as breakout or breakdown scenarios could create volatility. Investors considering DOT should weigh their risk tolerance, monitor key technical levels, and keep an eye on broader crypto market trends before entering a position.
Why is Polkadot Down today?
Polkadot’s slight decline to $2.15 today reflects short-term market hesitation rather than a fundamental issue. Selling pressure near the $2.24 resistance continues to limit upward moves, while buyers defend the $2.12 support. Overall, the market is consolidating, with traders awaiting clearer signals before committing to significant positions.
Broader crypto market sentiment also plays a role, as fluctuations in Bitcoin and Ethereum often influence altcoins like DOT. Low trading volumes and profit-taking by short-term traders can contribute to minor pullbacks, creating temporary weakness even in fundamentally strong projects.
Will Polkadot reach $10?
Yes, according to long-term predictions, Polkadot is projected to reach up to $10 by 2029.
Will Polkadot reach $20?
Yes, according to the long-term predictions, Polkadot is projected to reach up to $20 by 2032.
Will Polkadot reach $100?
Reaching $100 for Polkadot (DOT) is highly ambitious and unlikely in the near term.
Does Polkadot have a promising long-term future?
Based on Polkadot’s ongoing buying demand and positive community support, the DOT price is set to make new highs in the coming years. However, you are advised to do your research before investing in the volatile market, especially considering future performance.
Polkadot price prediction January 2026
Here are the current Polkadot price movements in January 2026. The potential low is $2.05, while the current price might average around $2.18. On the higher end, DOT could reach up to $2.26.
| Month | Potential Low | Potential Average | Potential High |
| January | $2.05 | $2.18 | $2.26 |
Polkadot price prediction 2026
The DOT price prediction for 2026 anticipates a minimum value of $1 and a maximum value of $2.35. The token price and the coin’s average value could be around $2.22.
| Polkadot Price Prediction | Potential Low | Potential Average | Potential High |
| 2026 | $1 | $2.22 | $2.35 |
Polkadot Price Predictions 2027-2032
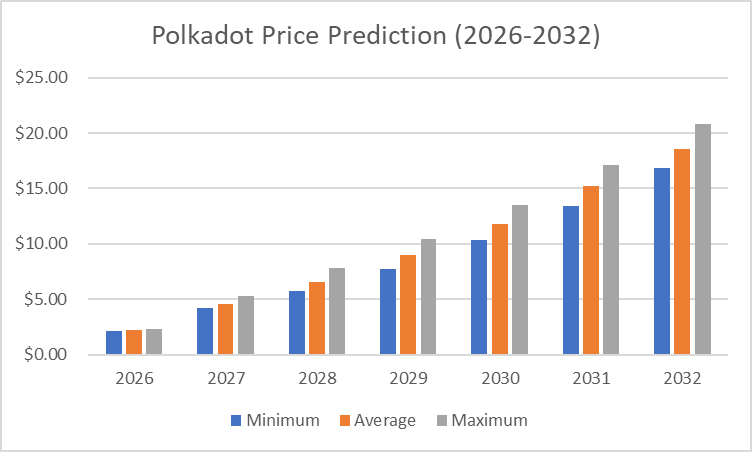
| Year | Minimum Price | Average Price | Maximum Price |
| 2027 | $4.18 | $4.57 | $5.25 |
| 2028 | $5.71 | $6.53 | $7.81 |
| 2029 | $7.71 | $8.95 | $10.47 |
| 2030 | $10.36 | $11.83 | $13.48 |
| 2031 | $13.45 | $15.25 | $17.10 |
| 2032 | $16.85 | $18.57 | $20.82 |
Polkadot price prediction 2027
According to the Polkadot prediction for 2027, DOT could reach a maximum price of $5.25, with the lowest price expected to be $4.18, and an average forecast price of $4.57.
Polkadot price prediction 2028
The price of Polkadot is predicted to reach a minimum value of $5.71 in 2028. Per expert analysis, DOT tokens could reach a maximum value of $7.81 and an average trading price of $6.53.
Polkadot price prediction 2029
Cryptopolitan predicts that in 2029, the Polkadot network will reach a minimum price level of $7.71, a maximum price of $10.47, and an average trading price of $8.95.
Polkadot forecast 2030
The price of Polkadot is predicted to reach a minimum value of $10.36 in 2030. Traders can anticipate a maximum value of $13.48 while monitoring key support levels and an average trading price of $11.83.
Polkadot price prediction 2031
According to the Polkadot price prediction for 2031, DOT could reach a maximum price of $17.10, a minimum price of $13.45, and an average forecast price of $15.25.
Polkadot price prediction 2032
In 2032, Polkadot’s price is predicted to reach a minimum level of $16.85. Should positive market sentiment persist, DOT can attain a maximum cost of $20.82 and an average trading price of $18.57.
Polkadot market price prediction: Analysts’ DOT price forecast
| Firm | 2026 | 2027 |
| DigitalCoinPrice | $3.92 | $5.25 |
| Coincodex | $2.19 | $2.22 |
Cryptopolitan’s Polkadot (DOT) Price Prediction
For 2026, Polkadot is expected to trade between $1 and $2.35, with an average price near $2.25. Continued network growth and adoption could support gradual gains. By 2032, DOT could reach up to $20.82.
Polkadot historic price sentiment
- After spending most of the second half of 2020 trading around $4-$5, the price broke above the previous all-time high of $7 on December 29 and quickly reached the Polkadot price projection of $10.

Polkadot price history | Coinmarketcap
- Polkadot experienced rapid growth, with its price climbing from around $3 in January to an all-time high of approximately $57.50 in May 2021.
- After the peak, the price declined sharply, falling to around $10 by July before partially recovering to over $40 in November 2021.
- In 2022, Polkadot price steadily declined, starting the year around $30 and dropping below $10 by mid-year.
- By the end of 2022, the price stabilized near $5 as bearish market conditions dominated the cryptocurrency space.
- The price of DOT hovered between $5 and $7 for most of 2023, reflecting a period of consolidation and limited market excitement.
- In January 2024, Polkadot’s price remained relatively stable, trading around the $5–$6 range.
- By July 2024, Polkadot showed slight signs of recovery, with its price rising to around $7–$8. This modest uptick was likely driven by increasing market interest.
- In December 2024, Polkadot showed signs of recovery, with its price climbing to around $10.4.
- In January 2025, Polkadot peaked at $7.98 but lost momentum towards the end of the month, resulting in a trading range of $4.64 to $5.28 in February.
- In March 2025, Polkadot (DOT) traded at approximately $4.30.
- In April 2025, Polkadot (DOT) experienced a gradual downtrend, with its price hovering slightly below the $4 mark amid ongoing market volatility.
- In May, Polkadot (DOT) began trading at around $ 4.10 and exhibited moderate fluctuations. As of the latest update, the price has declined slightly and is currently hovering near $ 3.90, reflecting a mild bearish trend so far.
- Polkadot (DOT) declined from a high of around $4.20 to approximately $3.30 in June, with a consistent downtrend and brief rebounds near $3.60 in July.
- In August 2025, Polkadot traded around $4.10, maintaining a steady pace with limited volatility. The price slightly dipped during September 2025, hovering near $4.00 as market sentiment remained neutral.
- By October 2025, DOT showed mild recovery, trading near $4.30, suggesting cautious accumulation among traders amid broader market stabilization.
- As of November 2025, Polkadot price fluctuated between $2.55 and $2.67 before stabilizing around $2.60.
- Polkadot fell from roughly $2.7 in early November to about $2.1 by the end of the month, holding near the same level in early December.
- As of January 2026, Polkadot (DOT) has traded in a relatively tight range between roughly $2.10 and $2.25, with brief intraday rebounds toward $2.22 before pulling back to around $2.17.


You May Also Like

Lowe’s (LOW) Stock Falls After Earnings Beat Gets Overshadowed by Weak Guidance

David Schwartz Responds to XRP Critics With “Haters” Remark


