Bitcoin Block Channel Reveals $400,000 Price Target – Details
The Bitcoin market continues to witness an intense price correction in line with broader crypto market movement. In the past week, the premier cryptocurrency recorded another 10% price decline, trading as low as $80,800, before experiencing a modest bounce.
Bitcoin now stands 32.79% below its all-time high, with distribution taking preference over accumulation for most investors. However, popular analyst Gert Van Lagen has unveiled an on-chain trend that postulates an impending revival of the bull market.
Bitcoin Historical Post-Halving Movement Indicates Bullish Hope
In an X post on November 21, Gert Van Lagen outlines a positive Bitcoin price prediction based on data from the previous post-halving movement. The renowned analyst explains this forecast, using a long-term logarithmic chart of Bitcoin’s price vs Bitcoin block height, which highlights a regression channel the digital asset has followed since 2009.
According to Van Lagen, Bitcoin has followed a similar pattern after every halving, which usually begins with pushing above the midline of this long-term regression channel. Thereafter, the premier cryptocurrency accelerates into a blow-off top (orange spikes) at the channel’s upper boundary as seen in 2013, 2017, and 2021.
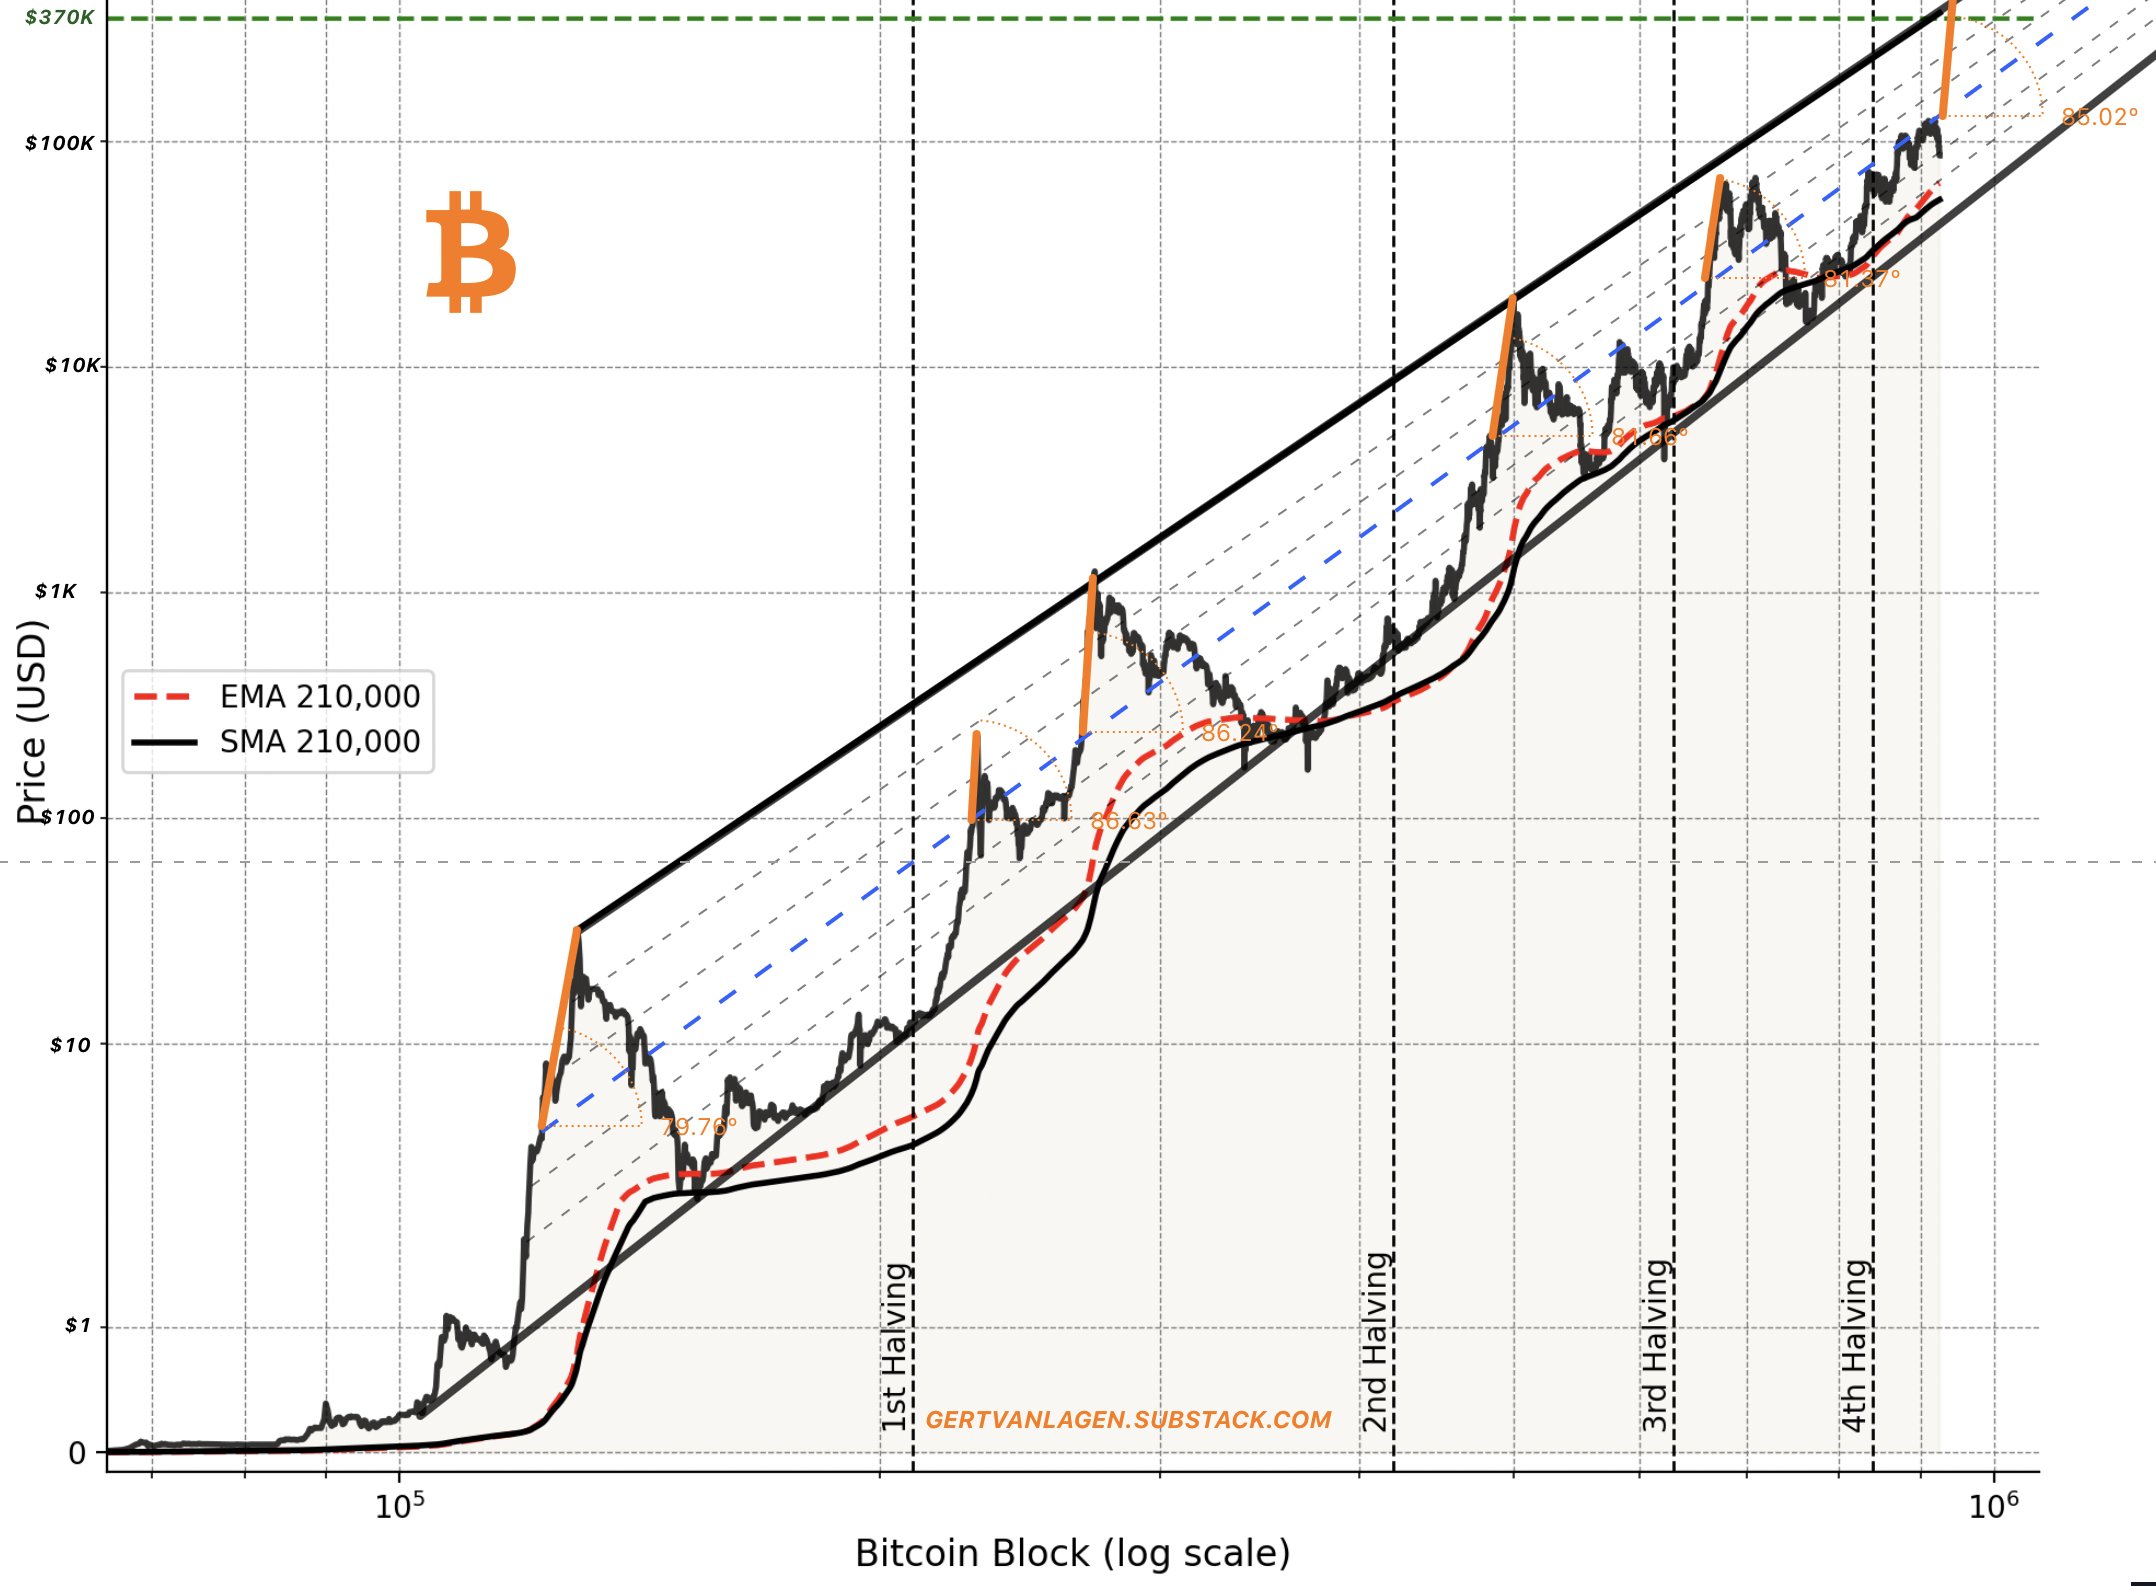
For all its price exploits in the present market cycle, Bitcoin presently trades just below the midline of the regression channel, suggesting there is ample space for price appreciation. However, Van Lagen notes some unusual price behavior in that Bitcoin has experienced rejection thrice at this midline, each time resulting in a bounce off the 0.382 Fibonacci retracement line.
Nevertheless, the analyst still expects the premier cryptocurrency to maintain the 15-year historical trend and eventually secure a decisive move above the midline resistance. If this price development occurs, Van Lagen also predicts Bitcoin to rise to around $350,000 – $400,000, a price range target that aligns with the upper boundary of the regression channel.
The ‘Genuine’ Bearish Market
Despite the heightened fears of a bearish market at the moment, Van Lagen explains that the much-dreaded crypto winter only commences after Bitcoin reaches its upper boundary target, establishing a market top. Based on the presented analysis, the market expert predicts Bitcoin will crash from this market peak to retest the 210,000 block SMA, i.e, the lower trend line of the regression channel.
At the time of writing, Bitcoin is valued at $84,300 after a 2.36% price loss in the past day. In the last month, the crypto market leader has experienced a 21.96% price devaluation, suggesting a rather volatile and cautious market condition.
Featured image from Pexels, chart from Tradingview
You May Also Like

XRP Ledger Transactions Are Exploding. Here’s the Latest

Trump's 'massive political weakness' has him trapped with no way out: analyst