Solana Price Crash To $100 Likely As SOL Nears Death Cross, But There’s A Catch
Solana is facing renewed bearish pressure as its price continues to slide, bringing the altcoin close to a critical support level that has not been tested in more than seven months.
The ongoing decline reflects deepening market weakness, and technical indicators suggest that further losses may be ahead unless conditions shift quickly.
Solana Investors Are Facing Heavy Losses
Solana’s exponential moving averages are signaling the potential formation of a Death Cross.
This pattern occurs when the short-term EMA crosses below the long-term EMA, often indicating the start of a prolonged downtrend. Historical behavior suggests that Solana may be repeating earlier market cycles seen in Q1 and Q2 of this year.
During those periods, SOL fell 59% from the local top before the Death Cross fully materialized.
A similar setup today would send Solana toward $98, extending its current 47% drop from the local top.
These conditions highlight weakening sentiment and reinforce concerns about continued downside risk.
Want more token insights like this? Sign up for Editor Harsh Notariya’s Daily Crypto Newsletter here.
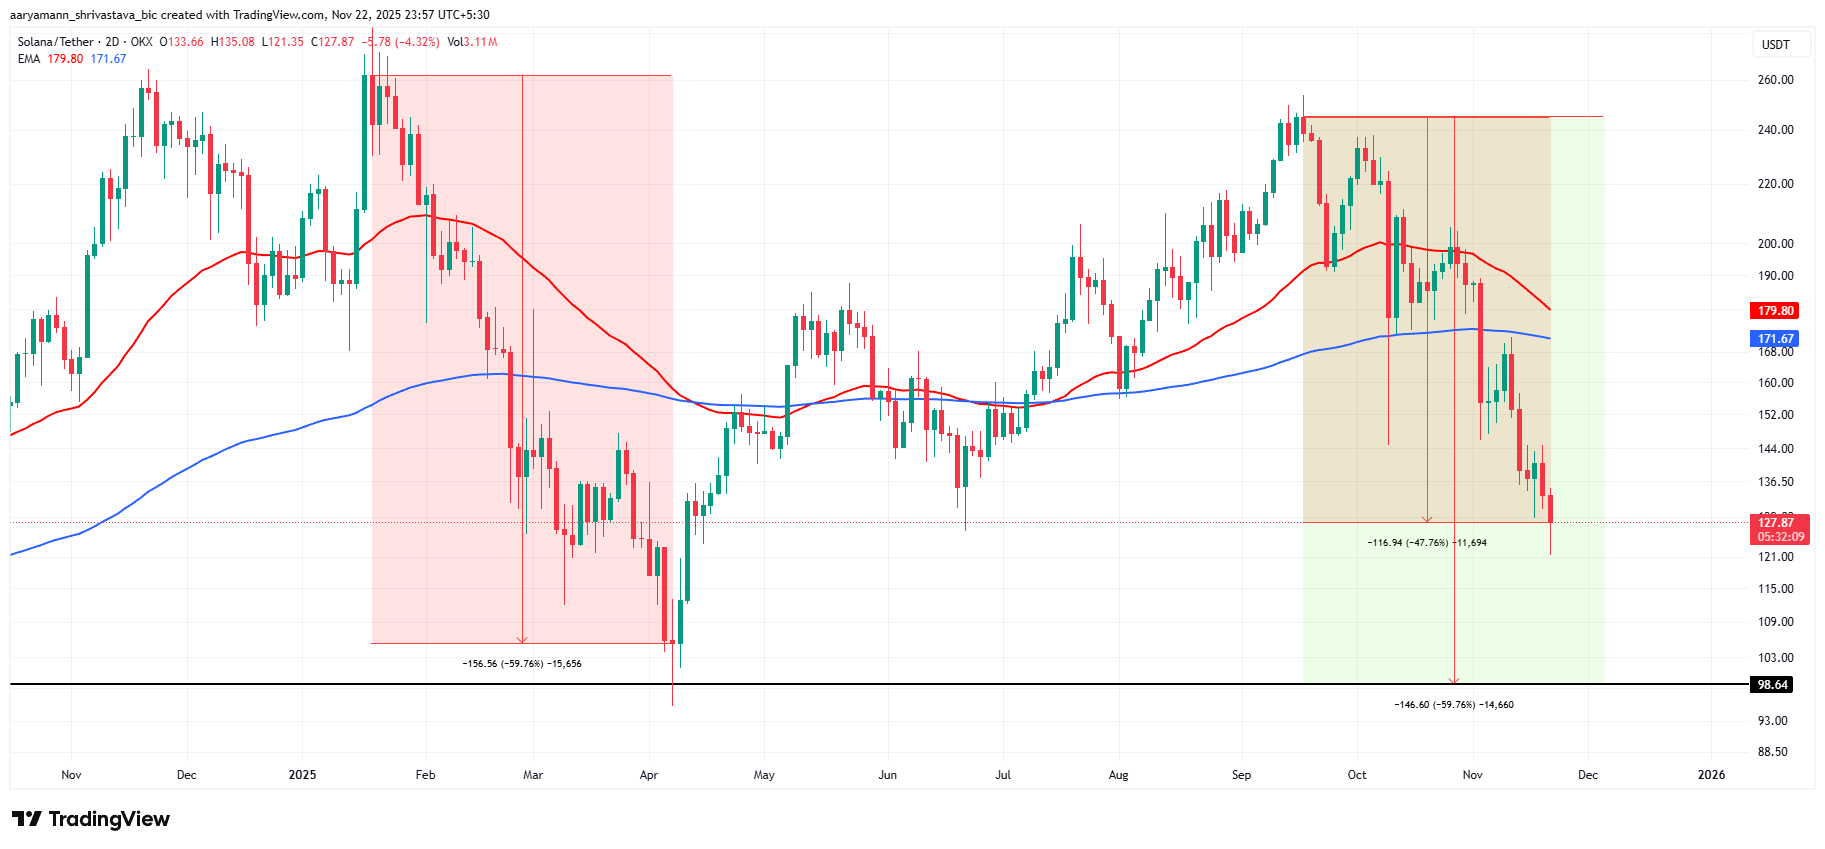 Solana EMAs. Source: TradingView
Macro momentum also appears fragile. Solana’s net realized profit/loss ratio has fallen to its lowest level since June 2023, showing that holders are facing significant realized losses following the recent decline.
This metric often reflects broader sentiment shifts as investors reassess risk during rapid market downturns.
However, there is a notable silver lining. When the net realized profit/loss ratio dips below 0.1, reversals have historically followed.
This pattern played out in March, April, and September of 2023, each time signaling the start of a recovery.
If this trend repeats, Solana could see a meaningful bounce as realized losses saturate and selling pressure stabilizes.
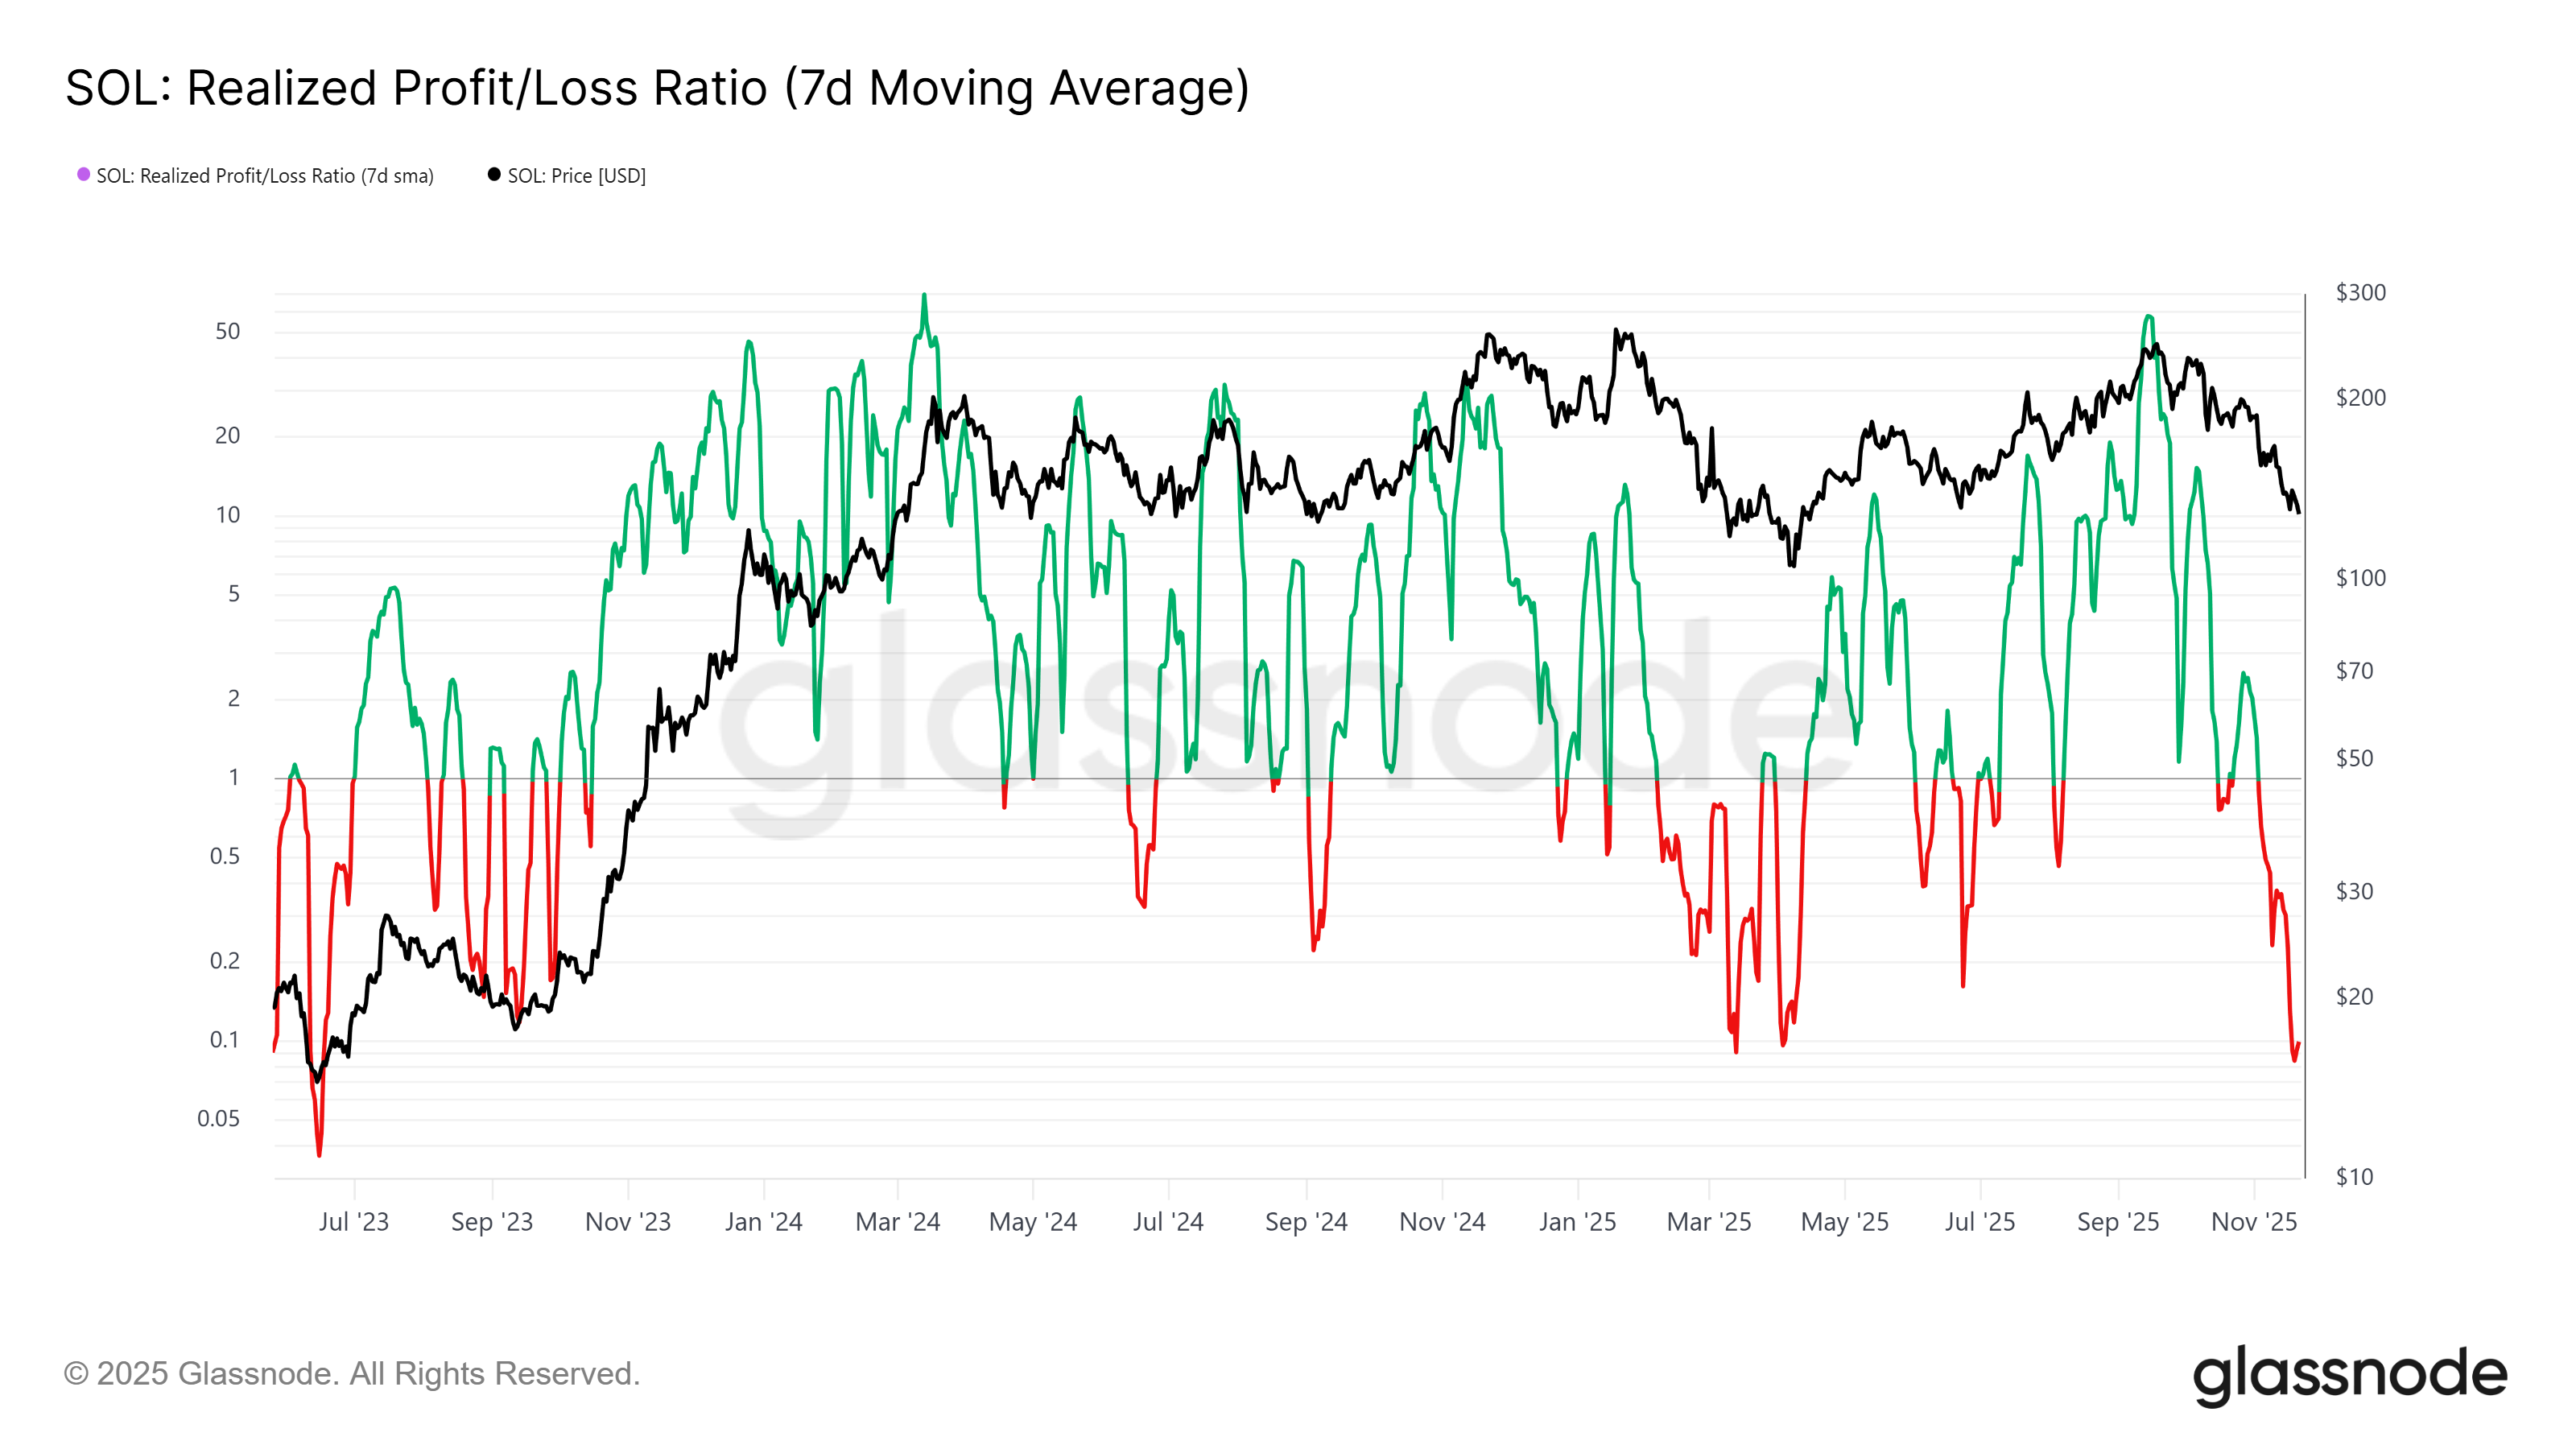 Solana Realized Profit/Loss. Source: Glassnode
SOL Price Is Vulnerable
Solana trades at $127, holding just above the $123 support level. The altcoin is waiting for broader market stability and renewed investor confidence to fuel a rebound.
However, the indicators mentioned above suggest that the risks remain skewed to the downside.
If Solana moves closer to confirming a Death Cross, the price may continue falling, breaking below $123 and sliding to $105 or even $100.
Such a move would represent a 21.8% correction from current levels and revisit price zones last seen in March.
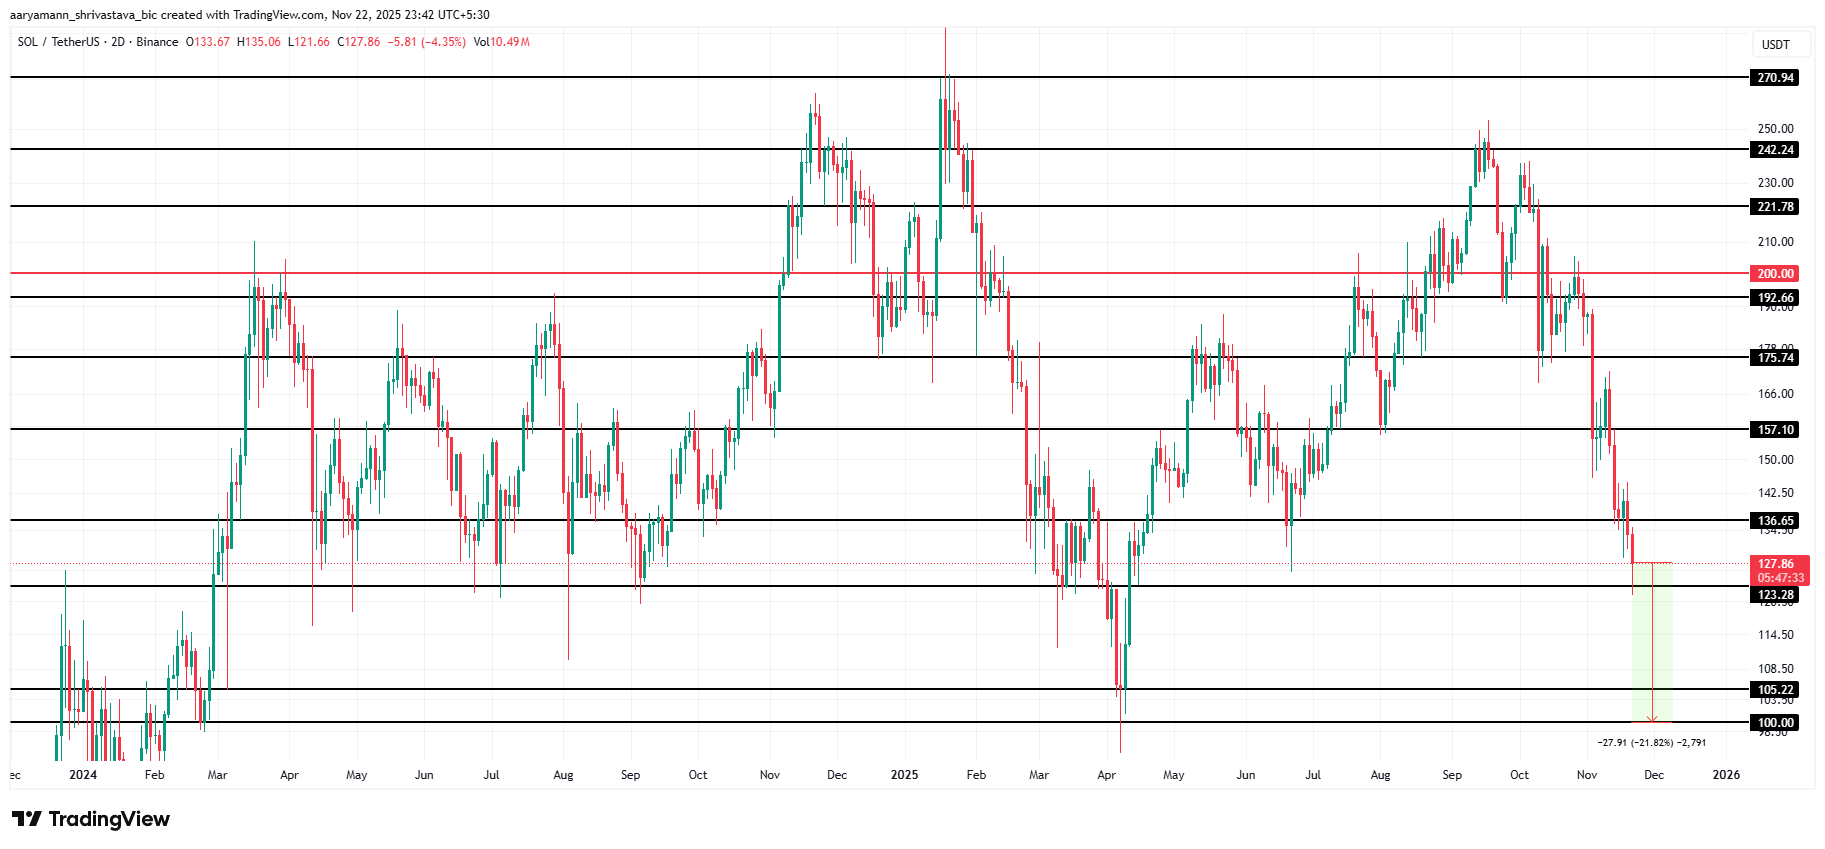 Solana Price Analysis. Source: TradingView
If realized losses stabilize and investor sentiment improves, Solana could bounce from $123 and attempt a climb to $136.
A break above this barrier would open the path toward $157, invalidating the bearish thesis and restoring a more bullish structure.


You May Also Like

Elon Musk trial on track as Washington securities case

Egrag Crypto to XRP Investors: You’re Either Early Or You’re Exit Liquidity