Cardano (ADA) Price Prediction 2025–2030: Can ADA Hit $0.32 Soon?
- Cardano nears critical trendline as sellers strengthen control over market momentum.
- ADA risks deeper correction if $0.38 breaks, exposing vulnerable downside targets.
- Buyers must reclaim $0.46 soon to prevent multi-year structural breakdown.
Cardano’s price has slipped to around $0.398 as it continues to struggle under heavy selling pressure. The cryptocurrency recently broke below a multi-month support level and is now testing a critical long-term trendline that has been intact since 2023. Although the Cardano network remains fundamentally strong and developers have quickly addressed recent concerns, market behavior continues to reflect broader risk weakness and persistent negative flows.
The central question now is whether ADA can reclaim momentum above key resistance levels, or if sellers will push the coin into deeper corrective territory toward the $0.32 demand zone.
Also Read: XRP Price Prediction 2025–2030: Can XRP Hit $3 Soon?
ADA Loses Key Support as Sellers Tighten Control
Cardano’s decline intensified after the cryptocurrency decisively lost the $0.52 support level, a zone that had acted as a major price floor for nearly a year. This breakdown allowed the weekly candle to slide directly into the ascending trendline formed from the 2023 lows, which now stands as ADA’s final line of structural defense.
A weekly close beneath this trendline would confirm a complete break of the multi-year wedge formation and potentially expose the price to a broader slide toward $0.35 and even $0.32.
Technical indicators continue to align with the bearish momentum. The weekly RSI has dropped to around 33, drifting toward oversold conditions, while the MACD continues to widen to the downside, indicating that sellers remain firmly in control.
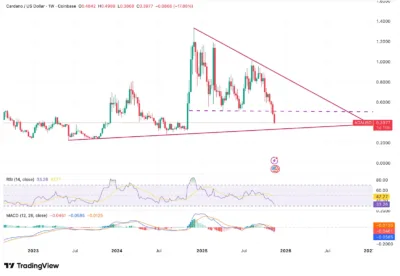
Source: Tradingview
Even as ADA approaches historically reactive price levels, buyers have not yet shown the type of strong counter-pressure that typically accompanies major support retests, making the current structure increasingly vulnerable.
Downtrend Strengthens on Lower Timeframes
On the lower timeframes, ADA remains in a decisive downtrend. The 4-hour chart shows the price trading well below a declining channel, while the 20, 50, 100, and 200 EMAs continue to fan out above the market, forming a dense zone of resistance between $0.43 and $0.46. Every attempt at a relief rally has been rejected beneath this region, reinforcing the bearish structure that has persisted for several weeks.
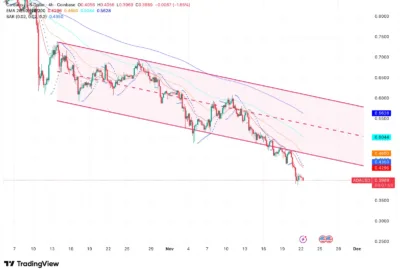
Source: Tradingview
Price action continues to display weakness, failing to reclaim even the midline of the descending channel. The Parabolic SAR maintains its position above the price, signaling continued downward pressure. As long as ADA remains below this confluence of resistance levels, traders will continue to treat each bounce as purely corrective rather than indicative of a trend reversal.
Spot Outflows Rise as Market Sentiment Weakens
Market data shows that ADA is experiencing sustained negative spot flows, with $2.50 million in net outflows recorded over the past 24 hours. This adds to a multi-week trend in which ADA has seen more days of outflows than inflows since early October.
Such behavior reflects a reduction in investor willingness to hold ADA in private wallets and an increase in liquidity moving onto exchanges, a pattern that typically signals weak demand and prospective selling pressure. The persistent outflows underscore the difficulty ADA faces in generating upward momentum, particularly while macroeconomic conditions remain risk-averse.
Network Incident Adds Noise but Does Not Change Price Structure
A recent network incident drew considerable social media attention, with some community members speculating that the Cardano blockchain had halted. Core contributors quickly clarified the situation, emphasizing that block production never stopped and that the protocol continued running throughout the event.
LaPetiteADA explained that the network “never went down,” praising the resilience of the system and the coordination among SPOs and developers who quickly deployed the necessary fix. Charles Hoskinson reinforced this message, stating plainly that “the network survived, it didn’t stop, and ultimately the attack failed,” urging SPOs to upgrade to version 10.5.3 to restore fully unified chain operation.
Although these clarifications helped stabilize community sentiment, the market reaction remained muted. Cardano’s technical decline began well before the incident, and current price behavior continues to reflect macro pressures rather than any fundamental weakness in the protocol itself.
Will Cardano Go Up? Can ADA Reclaim $0.46?
The bullish scenario for ADA requires the cryptocurrency to hold the multi-year trendline currently being tested. From there, ADA must regain strength by reclaiming the $0.46 level with convincing volume. This area, which includes the EMA cluster and upper channel resistance, represents the first real signpost of potential recovery. A close above it would indicate the beginning of a structural shift and reduce the likelihood of a deeper correction.
The bearish scenario becomes far more likely if ADA breaks below $0.38. A clean violation of this level would confirm a breakdown of the long-term trendline and expose the lower demand zones at $0.35 and $0.32. Unless buyers step in with significant conviction, the price could continue drifting downward toward these targets, especially if negative flows persist.
Cardano (ADA) Price Prediction 2025–2030
| Year | Minimum ($) | Average ($) | Maximum ($) |
| 2025 | 0.32 | 0.40 | 0.46 |
| 2026 | 0.38 | 0.52 | 0.60 |
| 2027 | 0.50 | 0.68 | 0.75 |
| 2028 | 0.62 | 0.82 | 0.95 |
| 2029 | 0.75 | 1.05 | 1.30 |
| 2030 | 0.90 | 1.25 | 1.55 |
Year-by-Year Outlook
2025
ADA is expected to trade between $0.32 and $0.46 as it attempts to stabilize following its breakdown from major support. A successful reclaim of the $0.46 region with strong volume could signal the beginning of a short-term recovery phase, although the probability of such a move will depend heavily on broader market conditions.
2026
Improving sentiment across the crypto market may allow ADA to regain footing and climb back toward the $0.60 range. Renewed investor demand and growing participation within the Cardano ecosystem could support this upward trend, provided the broader macro climate also improves.
2027
As Cardano’s utility grows through expanded smart contract adoption and increased on-chain activity, ADA could experience stronger appreciation, potentially pushing the price toward $0.75. Continued ecosystem development and rising developer participation would play crucial roles in sustaining this upward momentum.
2028
By 2028, ADA may benefit from broader blockchain adoption as the network matures and its use cases continue to expand. If development growth accelerates, Cardano could reach a range between $0.82 and $0.95.
2029–2030
Toward the end of the decade, ADA could stabilize between $1.25 and $1.55, assuming the network continues attracting developers, institutions, and users. Ecosystem expansion, higher staking participation, and Cardano’s long-term commitment to decentralization could significantly contribute to this projected growth.
Conclusion
Cardano faces a defining moment as ADA trades directly on top of a multi-year trendline after losing its major $0.52 support. The near-term outlook remains uncertain, with sellers dominating price action and spot outflows rising across the board. Whether ADA can reclaim the $0.46 region will determine if the market can enter a recovery phase or whether a deeper drop toward $0.32 becomes inevitable.
Although the network remains resilient and its fundamentals strong, ADA’s price trajectory hinges on its ability to break the ongoing downtrend and establish higher-timeframe support. A sustained recovery could lift ADA substantially in the coming years, but such movement is far more likely to develop gradually rather than immediately.
FAQs
1. Why is ADA struggling near $0.398?
ADA is struggling at this level because it recently broke below multi-month support at $0.52 and now faces substantial resistance from the EMA cluster, while persistent negative spot flows continue to limit upward momentum.
2. Can ADA hit $1 soon?
ADA is not likely to reach $1 in the immediate term. The cryptocurrency must first reclaim $0.46 and establish consistent strength above major resistance levels before such a rally becomes possible.
3. What are the critical resistance levels for ADA?
The most important resistance levels lie between $0.43 and $0.46, where multiple EMAs and the upper channel boundary converge. A sustained breakout above $0.46 would signal a potential trend shift.
4. What happens if ADA breaks below $0.38?
A break below $0.38 would confirm a loss of the long-term trendline support and likely drive the price toward $0.35 and $0.32, where the next major demand zones are located.
4. When will ADA see significant growth again?
Significant growth is more likely to occur from 2027 onward, as Cardano’s ecosystem continues to expand and long-term adoption increases. Technical improvements, network upgrades, and broader market cycles will all play important roles in shaping this growth trajectory.
Also Read: Fasttoken (FAST) Price Prediction 2025–2029: Can FAST Hit $2.50 Soon?
The post Cardano (ADA) Price Prediction 2025–2030: Can ADA Hit $0.32 Soon? appeared first on 36Crypto.
You May Also Like

USDC Treasury mints 250 million new USDC on Solana

Banco Santander Launches Retail Crypto Trading via Openbank in Germany