Bitcoin Local Bottom To Fall Between These Two Levels – Analyst
The Bitcoin market remains in a prolonged correction phase, registering a 10.4% price drop in the last seven days. As multiple analysts attempt to chart the asset’s price trajectory amid this volatile period, recent on-chain data have revealed potential local bottom targets.
$55,900 Or $44,700 – How Low Can Bitcoin Go?
In an X post on November 23, prominent market analyst Ali Martinez shares some insight on Bitcoin’s potential downside targets, amid the heavy price correction seen in recent weeks. Since hitting a new all-time high of $126,198.07 in early October, the leading cryptocurrency has recorded multiple heavy price drops, trading as low as $81,000. Despite growing fears of a bear market, several analysts still consider the recent downswings to be a mere correction, with the expectation of a local bottom and eventual price rebound in the coming weeks. Using data from the MVRV Pricing Bands, Martinez has identified two potential targets for this anticipated price bottom.
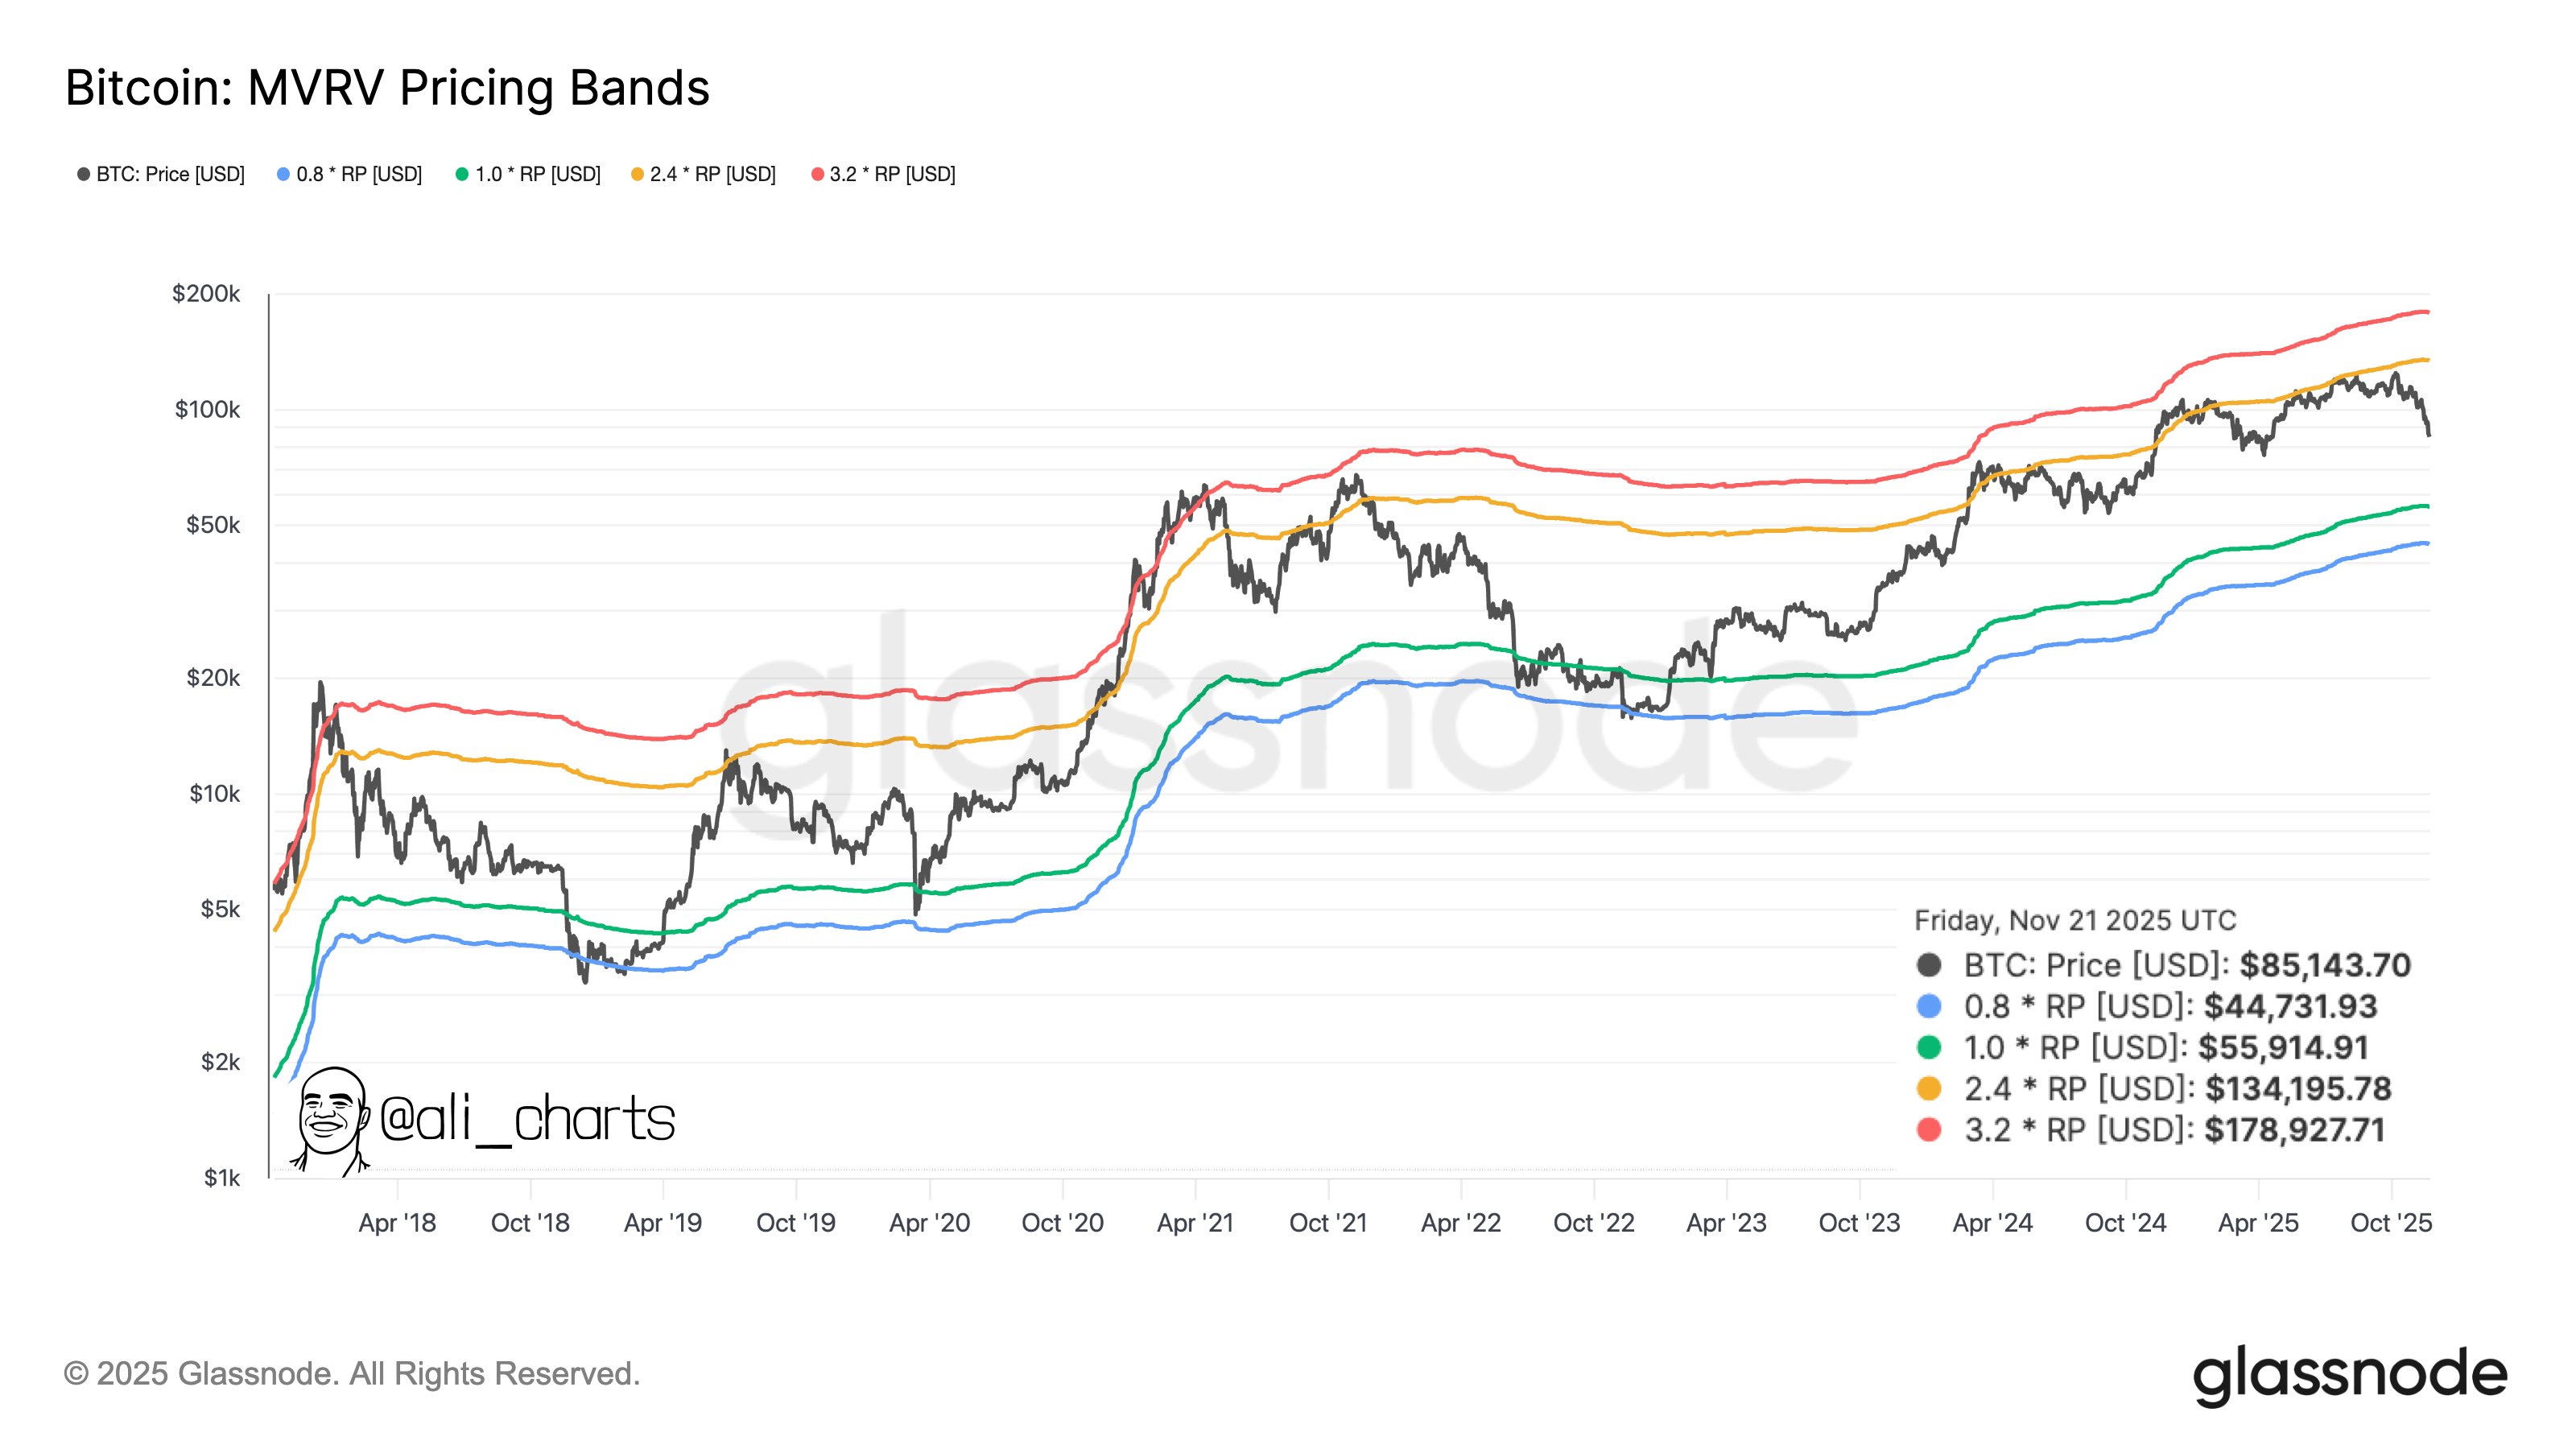
Generally, the MVRV Pricing Bands are price levels derived from the Market Value to Realized Value (MVRV) ratio that indicate whether a cryptocurrency is likely overvalued, undervalued, or fairly valued relative to the average price paid by investors. As seen in the chart above, these pricing levels have fixed multiples, i.e, 0.8x, 1.0x, 2.4x, 3.2x, that represent various degrees of undervaluation or overvaluation.
According to Martinez, Bitcoin has historically shown to establish a local bottom anytime it dipped below the 1.0*Realized Price (RP) (green line), and 0.8*RP (blue line), as seen around October 2018, April 2020, and November 2022. Presently, the 1.0*RP and 0.8*RP stand at $55,914 and $44,713, respectively, suggesting the premier cryptocurrency could still experience further price correction between 35% to 48% before relaunching another bullish wave.
On the other hand, if a bullish rebound occurs before or after hitting the local bottom targets, the MVRV pricing bands reveal impressive upside targets at $134,195 (2.4*RP) and $178,927 (3.2*RP), respectively.
Bitcoin Market Overview
At the time of writing, Bitcoin continues to trade at $85,938 following a slight price gain of 1.15% in the past day. Meanwhile, the asset’s daily trading volume is down by 68.09% and valued at $40.75 billion.
Amid Bitcoin’s price struggles, the US BTC Spot ETFs have also witnessed a similarly significant level of investor flight. According to data from SoSoValue, these investment funds have registered a total net outflow of $4.339 billion in the last four weeks.
You May Also Like

XRP Ledger Transactions Are Exploding. Here’s the Latest
Trump's 'massive political weakness' has him trapped with no way out: analyst