

Technical Gauges Point to Further Downside as Bitcoin Clings to Key Support

The price of Bitcoin has been unable to maintain a favorable position above the $90,000 mark over the past week. Market participants on the bearish side continued to exert pressure beneath the $88,000 mark, resulting in a decline in price.
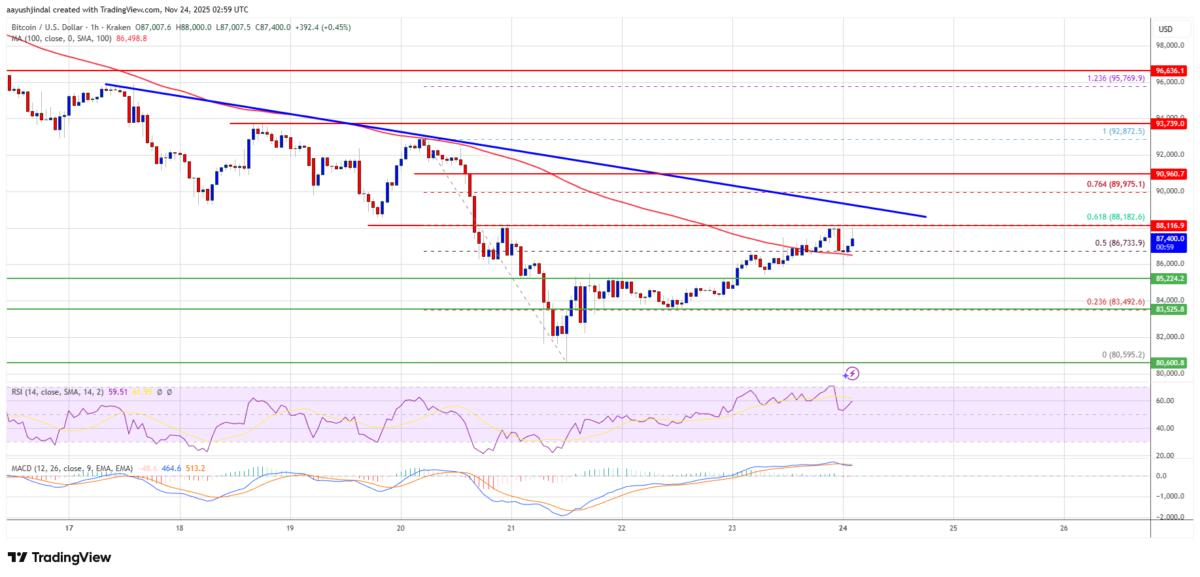
The sellers intensified their efforts and successfully drove the price beneath the $85,000 threshold. The price reached a low of $80,595 last week, and is currently in the process of making a recovery.
Bitcoin's price now sits above $85,000, and it has risen past the 50% Fibonacci retracement level of the recent drop from the $92,872 peak to the $80,595 trough.
At the moment, Bitcoin's price is below the 100-hour simple moving average and $89,000. On the hourly chart of the BTC/USD pair, a bearish trend line is appearing, suggesting that resistance is near $89,500.
In the event that the bulls launch another wave of recovery, the price can run into problems at the $88,150 level, which also happens to be the 61.8% Fibonacci retracement of the previous decline from the $92,872 high to the $80,595 low.
Near the $89,500 level and the trend line, there is the first major obstacle. Potentially $90,000 is the next resistance level. If prices manage to break over the $90,000 resistance level, they may continue to rise sharply.
Under these conditions, the price could rise and test the $92,500 level of resistance. If prices continue to rise, they might reach $93,200. Possible future levels of resistance for the bulls are $94,500 and $95,000.
The price of Bitcoin might go further lower if it is unable to break over the $89,500 barrier. Around the $86,500 level, you can find current support. Around the $85,000 level is when considerable support initially appears.
Presently, the $83,500 area is the location of the subsequent support level. If prices continue to fall, they may soon find support at the $82,500 level. If Bitcoin's value were to fall precipitously in the near future, it might find immediate support at the $80,000 mark.
Market participants are closely monitoring $85,200, recognizing it as a crucial support threshold following last week’s decline.
Currently, technical indicators and broader economic challenges are overshadowing fundamental factors. However, historical patterns indicate that these waves of selling frequently lead to recoveries, provided there are no unexpected disruptions.
TradingView's Bitcoin technical analysis gauge, based on the most popular technical indicators, such as moving averages, oscillators, and pivots, shows a sell signal for the week ahead.
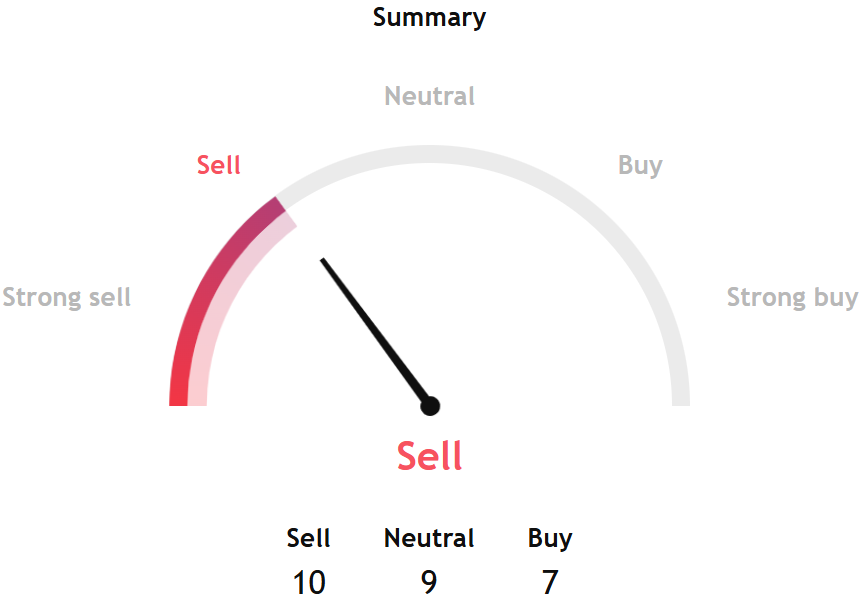 Source: TradingView
A further breakdown shows both short- and long-term gauges giving a similar signal.
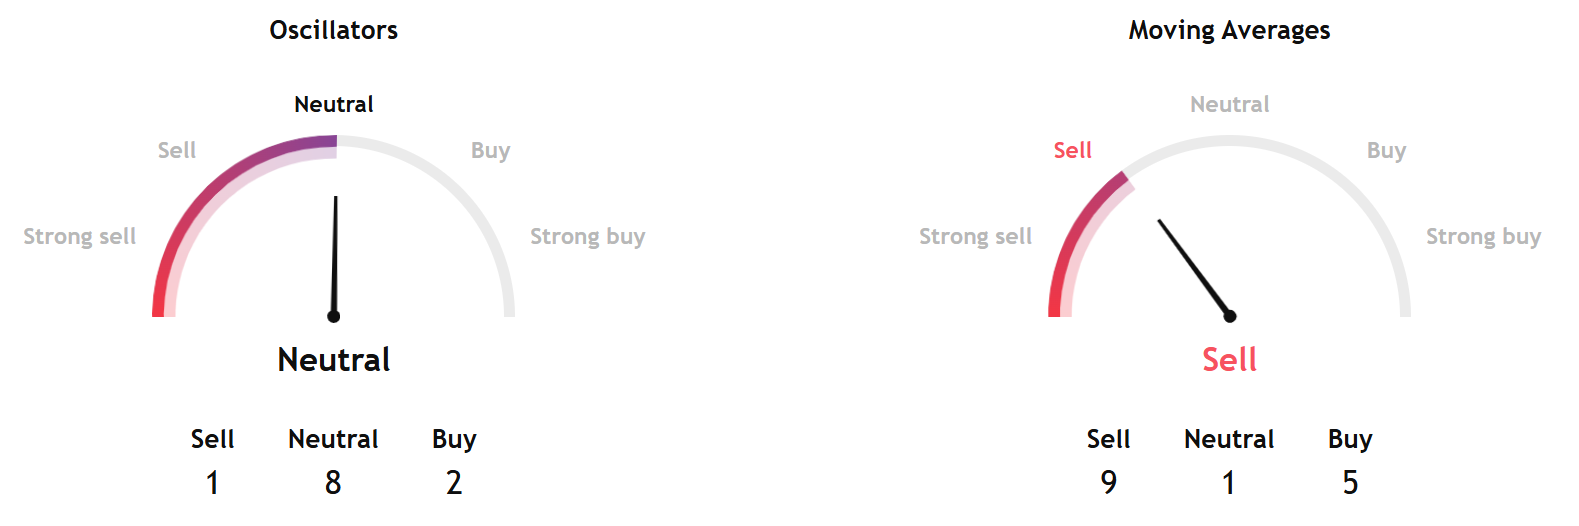 Source: TradingView
Separately, InvestTech's algorithmic overall analysis for the short term gives a negative score.
The firm said, "Bitcoin shows weak development in a falling trend channel in the short term. Falling trends indicate that the token experiences negative development and falling buy interest among investors. There is no support in the price chart, and further decline is indicated. In case of a positive reaction, the token has resistance at $107,500 points. Volume has previously been low at price tops and high at price bottoms. Volume balance is also negative, which confirms the trend."
InvestTech added, "RSI is below 30 after the falling prices of the past weeks. The token has strong negative momentum and further decline is indicated. However, particularly in big stocks, low RSI may be a sign that the stock is oversold and that there is a chance for a reaction upwards. The token is overall assessed as technically negative for the short term."
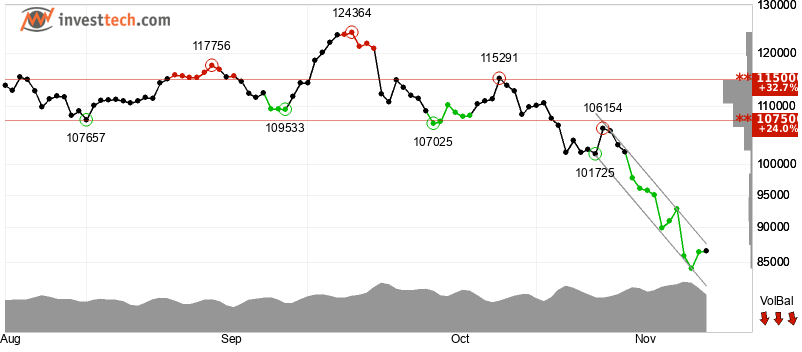 Source: InvestTech
ETF Flows Still Negative
Net outflows continued a four-week downward trend for US spot Bitcoin exchange-traded funds last week. According to SoSoValue, the spot Bitcoin ETFs saw a net outflow of $1.22 billion for the week ending November 21, bringing the cumulative outflow for the four weeks to $4.34 billion. While the funds saw withdrawals on the other trading days, they saw net inflows of $238.47 million and $75.47 million on Friday, respectively.
Among ETFs, BlackRock's IBIT had $1.09 billion in outflows for the week, which was its second-biggest weekly outflow ever, second only to the $1.17 billion recorded in the week ending February 28. The fund lost a substantial amount of money last Tuesday, totaling $523.15 million.
The most notable correction in the cryptocurrency market this cycle coincided with last week's withdrawals; on Friday, Bitcoin fell to around $82,200 from $95,600 on Monday. The market capitalization of the most popular cryptocurrency has increased by 1.2%.
Meanwhile, spot Ethereum ETFs have experienced a decline in value for three consecutive weeks, culminating in a net outflow of $500.25 million last week. Even with consistent withdrawals during the week, ether ETFs experienced a net inflow of $55.71 million on Friday. Last week, there was a significant influx of $128.2 million into spot Solana ETFs, a notable increase from the $46.34 million recorded the week before.
Bitwise's XRP and Canary's XRPC both saw weekly inflows of $179.6 million for XRP, but it wasn't enough to match the remarkable $243.05 million that XRPC received on its second day of trade, November 14.
You May Also Like

Stablecoins Are Taking Over TradFi: Inside Ripple’s Massive 2026 Industry Survey

“Trusted the wrong people”—Hawk Tuah Denies Role in HAWK Token Collapse

