1,800,000,000 XRP Makes $1.75 a Key Area, Here’s Why
- Massive accumulation at $1.75 positions XRP for potential strong market reaction.
- Technical signals highlight rising volatility as XRP approaches major support.
- Traders monitor $2 range while $1.75 zone anchors broader sentiment.
Fresh attention has shifted toward XRP as new market data underscores the importance of the $1.75 zone. Traders have repeatedly observed price reactions near this level, and recent indicators continue to highlight why it remains one of the most critical areas on the chart.
According to Ali Martinez (@ali_charts), roughly 1,800,000,000 XRP (1.8 billion) was previously acquired at around $1.75. This major accumulation was confirmed through the latest Glassnode cost basis distribution heatmap, showing a dense cluster of holdings in that range. Besides this on-chain backdrop, the newest technical readings provide additional evidence reinforcing the significance of this area.
Moreover, XRP’s daily chart on TradingView shows the token trading near $2.04 as it attempts to stabilise after sustained downward pressure. Price tapped the lower Bollinger Band close to $1.90, a point that often signals oversold conditions during market pullbacks.
Also Read: XRP HTF Heatmap Points to Stronger Liquidity Above – What It Means
Technical Readings Highlight Why the $1.75 Zone Remains Critical
Significantly, the relative strength index sits at 38, while its signal line reads 39, which keeps XRP in a bearish zone but still near levels that can precede short-term relief. Additionally, the token remains below the 20-day simple moving average at $2.21, and that gap shows how much ground needs to be recovered before stronger bullish signals emerge.
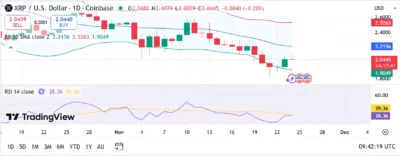
Source: Tradingview
Furthermore, widening Bollinger Bands suggests increasing volatility as the price approaches both support and resistance clusters. Recent candles show attempts to form slightly higher lows, and market watchers are measuring these patterns closely as they assess immediate sentiment.
This behaviour aligns with the idea that buyers around the $1.75 accumulation band remain alert to shifts in direction.
Market focus continues to centre on the $1.75 cost basis cluster, where 1.8 billion XRP changed hands according to the on-chain update. Price behaviour around this key band has consistently validated its importance within the broader structure. XRP now trades in a range shaped by strong historical accumulation and current technical signals that reflect both pressure and attempted recovery across the chart.
Also Read: 50,674,497 XRP Move Amid Franklin Templeton and Grayscale XRP ETF Launch Discussions – What’s Going On?
The post 1,800,000,000 XRP Makes $1.75 a Key Area, Here’s Why appeared first on 36Crypto.


You May Also Like

FLock.io and BitValue Capital Launch $200M Africa Fund II to Pioneer Decentralized AI Infrastructure
FDIC, OCC, and NCUA Propose New AML/CFT Rule Updates for Banks and Credit Unions