

Declining Trendline, Supply Zones Block Further Upside for Bitcoin

Bitcoin remains within a critical corrective pattern, testing a significant resistance zone at $91K–$93K following a notable rebound.
While there has been a recent uptick, the overall trajectory still leans negative, and the daily chart indicates that BTC is nearing a critical junction where the next significant movement is expected to be established.
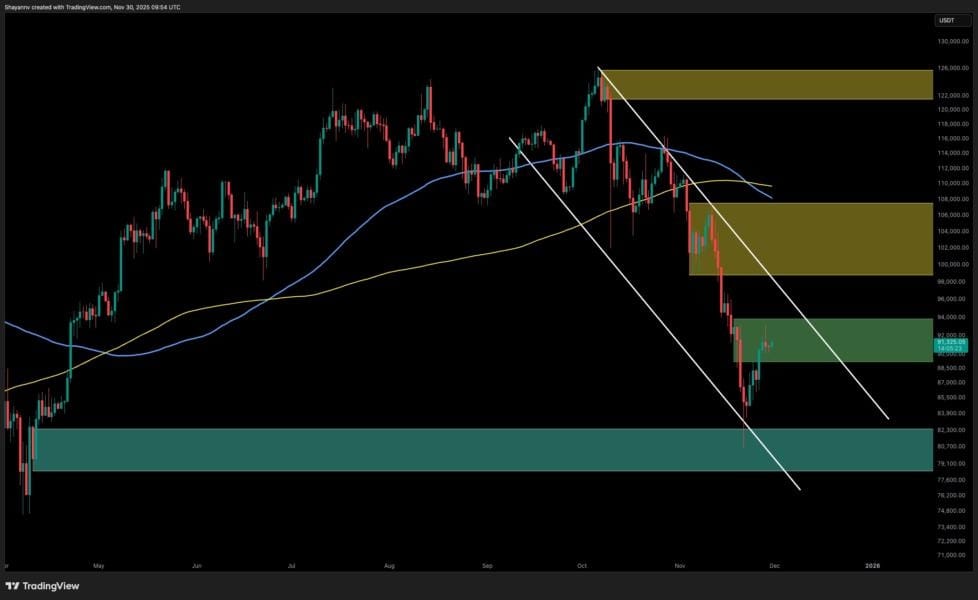
Most aggressive buying during the last month came during the recent rebound from the $80,000–$83,000 demand zone; however, the momentum has halted around the lower end of the green supply block, which is around $90,000–$93,000.
Above the market and acting as dynamic resistance levels, the 100-day and 200-day moving averages are consistently heading downward.
The general trend seems to be downward, even though the price remains below these moving averages.
Only by breaking back above the $103,000–$106,00 range—where the larger premium supply region and the previous breakdown framework converge—will the initial substantial reversal of negative momentum occur.
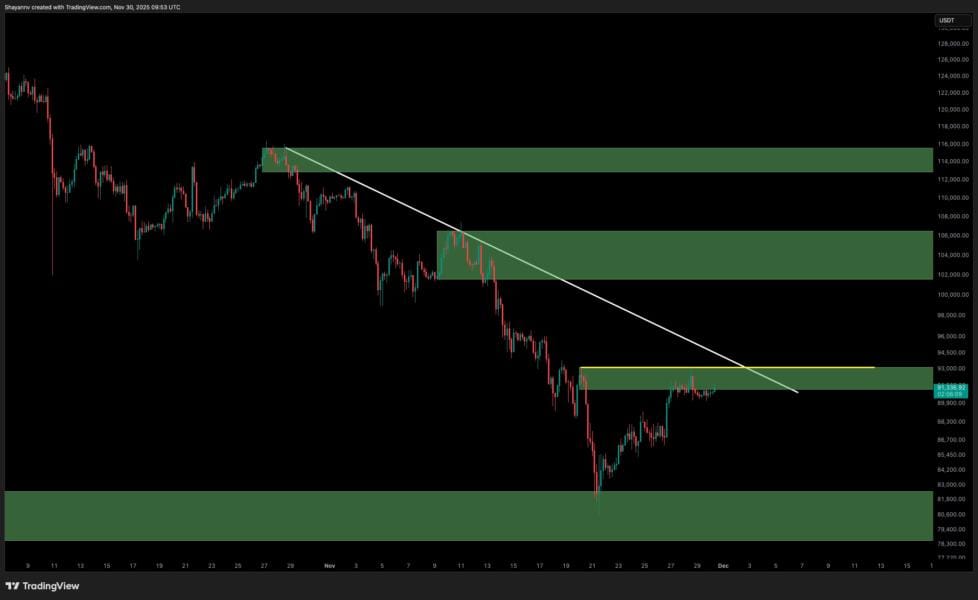
Bitcoin is currently struggling to break out of its declining trendline.
The market is clearly not ready for a sustained breakout because every advance into the $91K-$93 zone has signaled a decrease in momentum.
The asset has reached a significant resistance point on the 4-hour chart, characterized by the $92,000 bearish order block range and the multi-week declining trendline.
The most significant support level, situated within the $80K-$83 macro demand zone, provides enhanced liquidity. A drop below this threshold could result in a movement back towards the $86K-$88 range.
On the other hand, if we see a daily close above the $93K mark, it would pave the way toward the $102K–$106K inefficiency zone, where we anticipate the next significant reaction.
The market stands at a pivotal juncture, and the upcoming weeks will be crucial in deciding if this rebound transforms into a complete reversal or succumbs to the ongoing downtrend.
A strong "second layer" of resistance just above the $92,000 level, impacted by the average cost base of specific market players, is revealed by on-chain data, while technical indicators suggest that this level poses a considerable challenge.
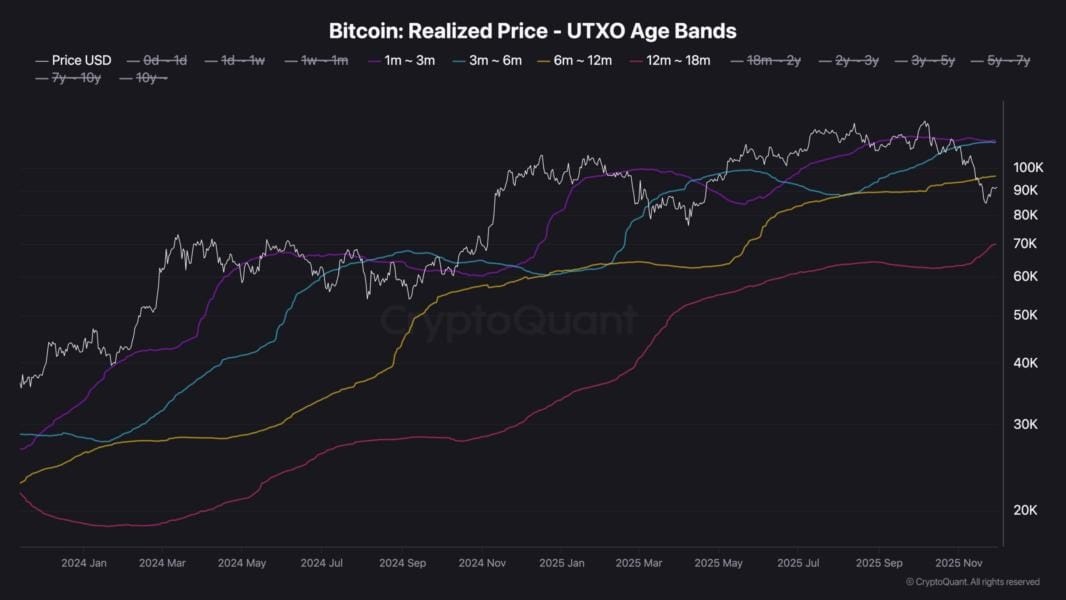
Support and resistance levels can be better identified using the Realized Price by UTXO Age Bands metric. This is because the realized price of a particular group often acts as a psychological threshold.
If the spot price drops below these levels, investors will lose money they didn't expect to. There is a lot of pressure on the sell side from these investors who want out when prices hit their average cost basis, which is often near breakeven.
At present, the chart emphasizes a significant intersection of two separate groups.
Those who bought within the last week to a month (green line) likely did so out of a sense of urgency or amid a recession.
The orange line represents the cohort that fell between 6 and 12 months ago; this group represents the medium-term holders who entered the market earlier this year.
Within the $96K-$97 range, the actual costs for both of these groups have been very similar.
A major obstacle to progressing upwards is this convergence. It is likely that the upward momentum may find weariness around the $96K-$97 level if Bitcoin manages to exceed the technical barrier around $92,000.
This is because these key groups are aiming to limit losses and depart from the market.
By bringing together the fears of short-term traders and the complacency of medium-term investors, this generational confluence amplifies the resistance.
If the market has successfully weathered current selling pressure and is ready for greater valuations, then we need to see a breakout over $97K.
Meanwhile, TradingView's Bitcoin technical analysis gauge, based on the most popular technical indicators, such as moving averages, oscillators, and pivots, gave a sell signal for the week ahead.
A deeper dive into the technical indicators showed a neutral stance for short-term gauges and a sell signal from long-term indicators.
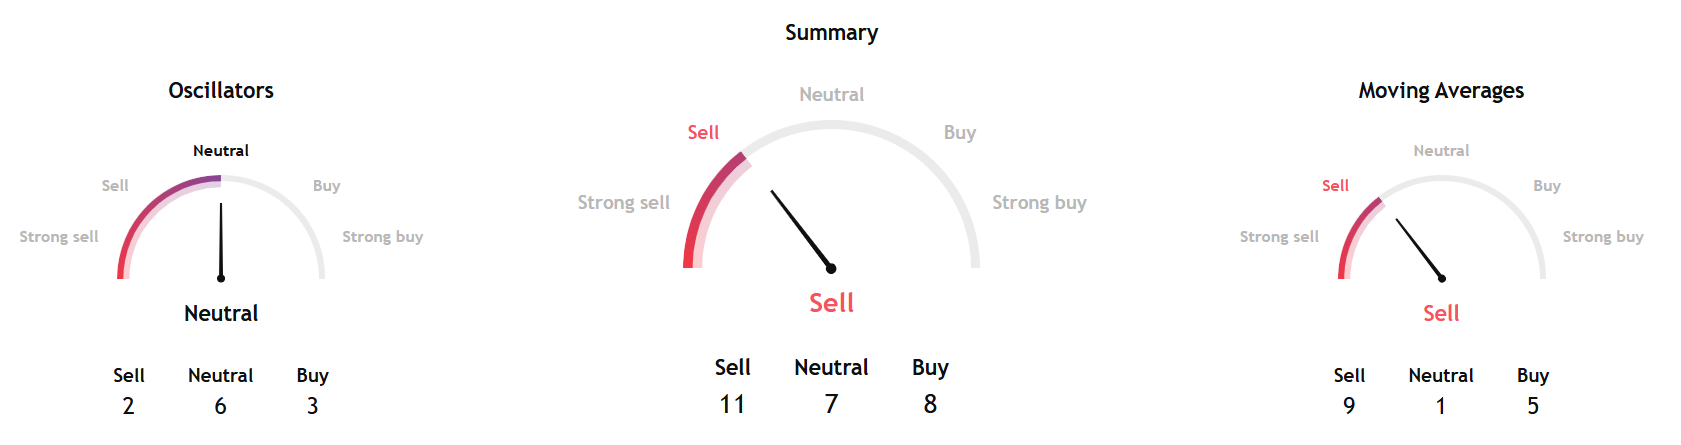 Source: TradingView
Separately, InvestTech's overall algorithmic analysis gave a weak negative score for Bitcoin in the short term.
The firm, on its one to six week recommendation, gave a negative score and said, "Bitcoin shows weak development in a falling trend channel in the short term. This signals increasing pessimism among investors and indicates further decline for Bitcoin. The token has support at $84,000 and resistance at $107,000.
InvestTech added, "Volume tops and volume bottoms correspond badly with tops and bottoms in the price. Volume balance is also negative, which confirms the trend. Bitcoin is overall assessed as technically negative for the short term."
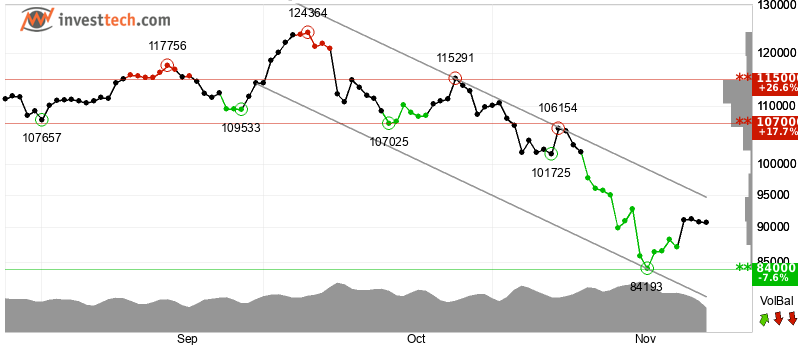 Source: InvestTech
Overall, technical analyses point to a downtrend for Bitcoin in the near term.


You May Also Like

The changing face of elder care in Malaysia — Sayed Mohammad Reza Yamani Sayed Umar

Not a loophole: Singapore AI export controls let China tap US AI legally

Best Mobile User Retention Tools in 2026


