TLDR Solana (SOL) dropped 5% on Monday to $126, marking its fifth consecutive day of losses and losing the gains from the previous week. Derivatives data shows bearish sentiment with Open Interest declining 6.17% to $7 billion and funding rates turning negative at -0.0055%. Long liquidations totaled $31.88 million compared to just $2.99 million in [...] The post Solana (SOL) Price: Fifth Day of Losses Pushes Token to $126 Support Level appeared first on CoinCentral.TLDR Solana (SOL) dropped 5% on Monday to $126, marking its fifth consecutive day of losses and losing the gains from the previous week. Derivatives data shows bearish sentiment with Open Interest declining 6.17% to $7 billion and funding rates turning negative at -0.0055%. Long liquidations totaled $31.88 million compared to just $2.99 million in [...] The post Solana (SOL) Price: Fifth Day of Losses Pushes Token to $126 Support Level appeared first on CoinCentral.

Solana (SOL) Price: Fifth Day of Losses Pushes Token to $126 Support Level

TLDR

  • Solana (SOL) dropped 5% on Monday to $126, marking its fifth consecutive day of losses and losing the gains from the previous week.
  • Derivatives data shows bearish sentiment with Open Interest declining 6.17% to $7 billion and funding rates turning negative at -0.0055%.
  • Long liquidations totaled $31.88 million compared to just $2.99 million in short liquidations over 24 hours, showing strong bearish control.
  • On-chain metrics reveal weakness with daily active addresses dropping from 7-9 million to 3-4 million since early 2025, while DEX volumes and Total Value Locked (TVL) have declined consistently.
  • Technical indicators show SOL defending the $121-$128 support zone for the third week, but a break below could push prices toward $100.

Solana continues its downward slide as the token trades at $126 following a 5% loss on Monday. This marks the fifth straight day of declining prices for the high-speed blockchain platform.

Solana (SOL) PriceSolana (SOL) Price

The broader crypto market selloff has pulled Bitcoin below $87,000. This triggered over $600 million in liquidations across the market in 24 hours.

Solana futures Open Interest dropped 6.17% to $7 billion in the last day according to CoinGlass data. Open Interest measures the total value of outstanding contracts in the derivatives market. The decline shows investors are pulling back their exposure to SOL positions.

The funding rate turned negative to -0.0055% on Monday. This metric indicates bears are paying a premium to hold short positions. When funding rates go negative, it reflects increased confidence among traders betting on price declines.

Long liquidations reached $31.88 million over 24 hours. Short liquidations only totaled $2.99 million during the same period. This gap demonstrates the strength of selling pressure that wiped out bullish positions.

On-Chain Activity Shows Weakness

Daily active addresses on Solana have fallen from 7-9 million earlier in 2025 to 3-4 million by midyear. The metric has stayed around this lower range since then. Active addresses track the number of unique wallets interacting with the network.
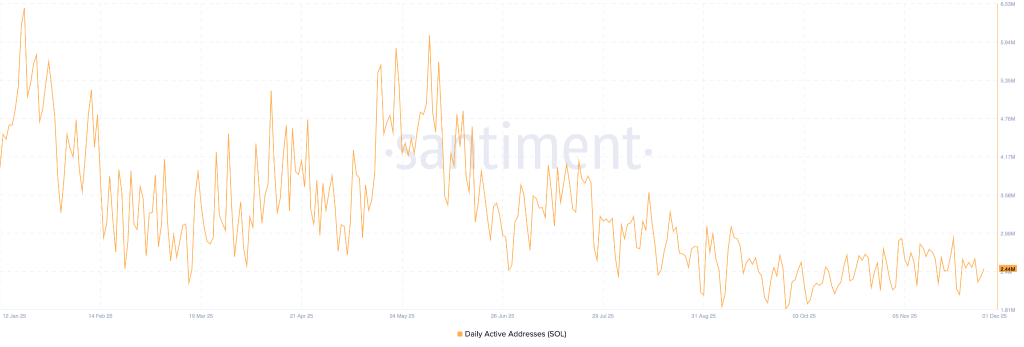
solana priceSource: Santiment

This decline points to reduced user engagement on the platform. Transaction growth has slowed alongside the drop in active users.

DEX volumes on platforms like Jupiter and Raydium have decreased since the beginning of the fourth quarter. The drop reflects fewer speculative inflows and lower fee burns. Earlier memecoin trading drove much of Solana’s activity, but this hype-driven volume has faded.

Total Value Locked has followed a similar downward pattern. Declining TVL indicates capital leaving the ecosystem and weakening confidence in the protocol.

Technical Levels Point to Further Risk

The SOL chart shows the formation of a bearish Marubozu candle on Monday. The five-day decline has erased gains from the previous week. The price now tests the $126 support level last seen on June 22.

A close below $126 could extend losses to $112, matching the March 11 low. The next support sits at $95 from April 7.

The Relative Strength Index sits at 33 on the daily chart. The indicator has remained below the 50 midline since early October. RSI hovering near the oversold boundary at 30 suggests potential for more selling.

The Moving Average Convergence Divergence stays above its signal line for now. A cross below would confirm renewed bearish momentum and trigger a sell signal.

Solana bulls are defending the $121-$128 support zone for the third consecutive week. This range has served as a strong base since early 2024 during previous periods of extended selling. Volume has drained during this defense attempt.

The weekly RSI follows a descending trend line. This pattern signals weakening rally strength. Current price action suggests further downside is possible toward $100 or slightly below in coming days.

The post Solana (SOL) Price: Fifth Day of Losses Pushes Token to $126 Support Level appeared first on CoinCentral.

Market Opportunity
Solana Logo
Solana Price(SOL)
$141.73
$141.73$141.73
-1.23%
USD
Solana (SOL) Live Price Chart
Disclaimer: The articles reposted on this site are sourced from public platforms and are provided for informational purposes only. They do not necessarily reflect the views of MEXC. All rights remain with the original authors. If you believe any content infringes on third-party rights, please contact [email protected] for removal. MEXC makes no guarantees regarding the accuracy, completeness, or timeliness of the content and is not responsible for any actions taken based on the information provided. The content does not constitute financial, legal, or other professional advice, nor should it be considered a recommendation or endorsement by MEXC.

You May Also Like

EUR/CHF slides as Euro struggles post-inflation data

EUR/CHF slides as Euro struggles post-inflation data

The post EUR/CHF slides as Euro struggles post-inflation data appeared on BitcoinEthereumNews.com. EUR/CHF weakens for a second straight session as the euro struggles to recover post-Eurozone inflation data. Eurozone core inflation steady at 2.3%, headline CPI eases to 2.0% in August. SNB maintains a flexible policy outlook ahead of its September 25 decision, with no immediate need for easing. The Euro (EUR) trades under pressure against the Swiss Franc (CHF) on Wednesday, with EUR/CHF extending losses for the second straight session as the common currency struggles to gain traction following Eurozone inflation data. At the time of writing, the cross is trading around 0.9320 during the American session. The latest inflation data from Eurostat showed that Eurozone price growth remained broadly stable in August, reinforcing the European Central Bank’s (ECB) cautious stance on monetary policy. The Core Harmonized Index of Consumer Prices (HICP), which excludes volatile items such as food and energy, rose 2.3% YoY, in line with both forecasts and the previous month’s reading. On a monthly basis, core inflation increased by 0.3%, unchanged from July, highlighting persistent underlying price pressures in the bloc. Meanwhile, headline inflation eased to 2.0% YoY in August, down from 2.1% in July and slightly below expectations. On a monthly basis, prices rose just 0.1%, missing forecasts for a 0.2% increase and decelerating from July’s 0.2% rise. The inflation release follows last week’s ECB policy decision, where the central bank kept all three key interest rates unchanged and signaled that policy is likely at its terminal level. While officials acknowledged progress in bringing inflation down, they reiterated a cautious, data-dependent approach going forward, emphasizing the need to maintain restrictive conditions for an extended period to ensure price stability. On the Swiss side, disinflation appears to be deepening. The Producer and Import Price Index dropped 0.6% in August, marking a sharp 1.8% annual decline. Broader inflation remains…
Share
BitcoinEthereumNews2025/09/18 03:08
Zero Knowledge Proof (ZKP) vs DOGE, SHIB, and PEPE: Good Crypto to Buy Now for Structure-Driven Gains

Zero Knowledge Proof (ZKP) vs DOGE, SHIB, and PEPE: Good Crypto to Buy Now for Structure-Driven Gains

In crypto, most gains don’t come when a chart is trending; they come before it. Real returns are usually locked in through smart entry, not loud exit points. That
Share
LiveBitcoinNews2026/01/16 08:00
XRP Could Explode as XRPL Targets Weak Links and Long-Trapped Liquidity

XRP Could Explode as XRPL Targets Weak Links and Long-Trapped Liquidity

The post XRP Could Explode as XRPL Targets Weak Links and Long-Trapped Liquidity appeared on BitcoinEthereumNews.com. XRP optimism is rebounding as long-term builders
Share
BitcoinEthereumNews2026/01/16 08:37