Ethereum sell off crypto: where ETH could find its next footing
 The sell off phase for the Ethereum crypto has shifted from headline risk to lived reality for traders watching ETH slide back toward the mid-2800s against USDT. However, beneath the sharp move lower, the technical picture offers clues on whether this is the late stage of a capitulation phase or the prelude to a deeper downtrend.
 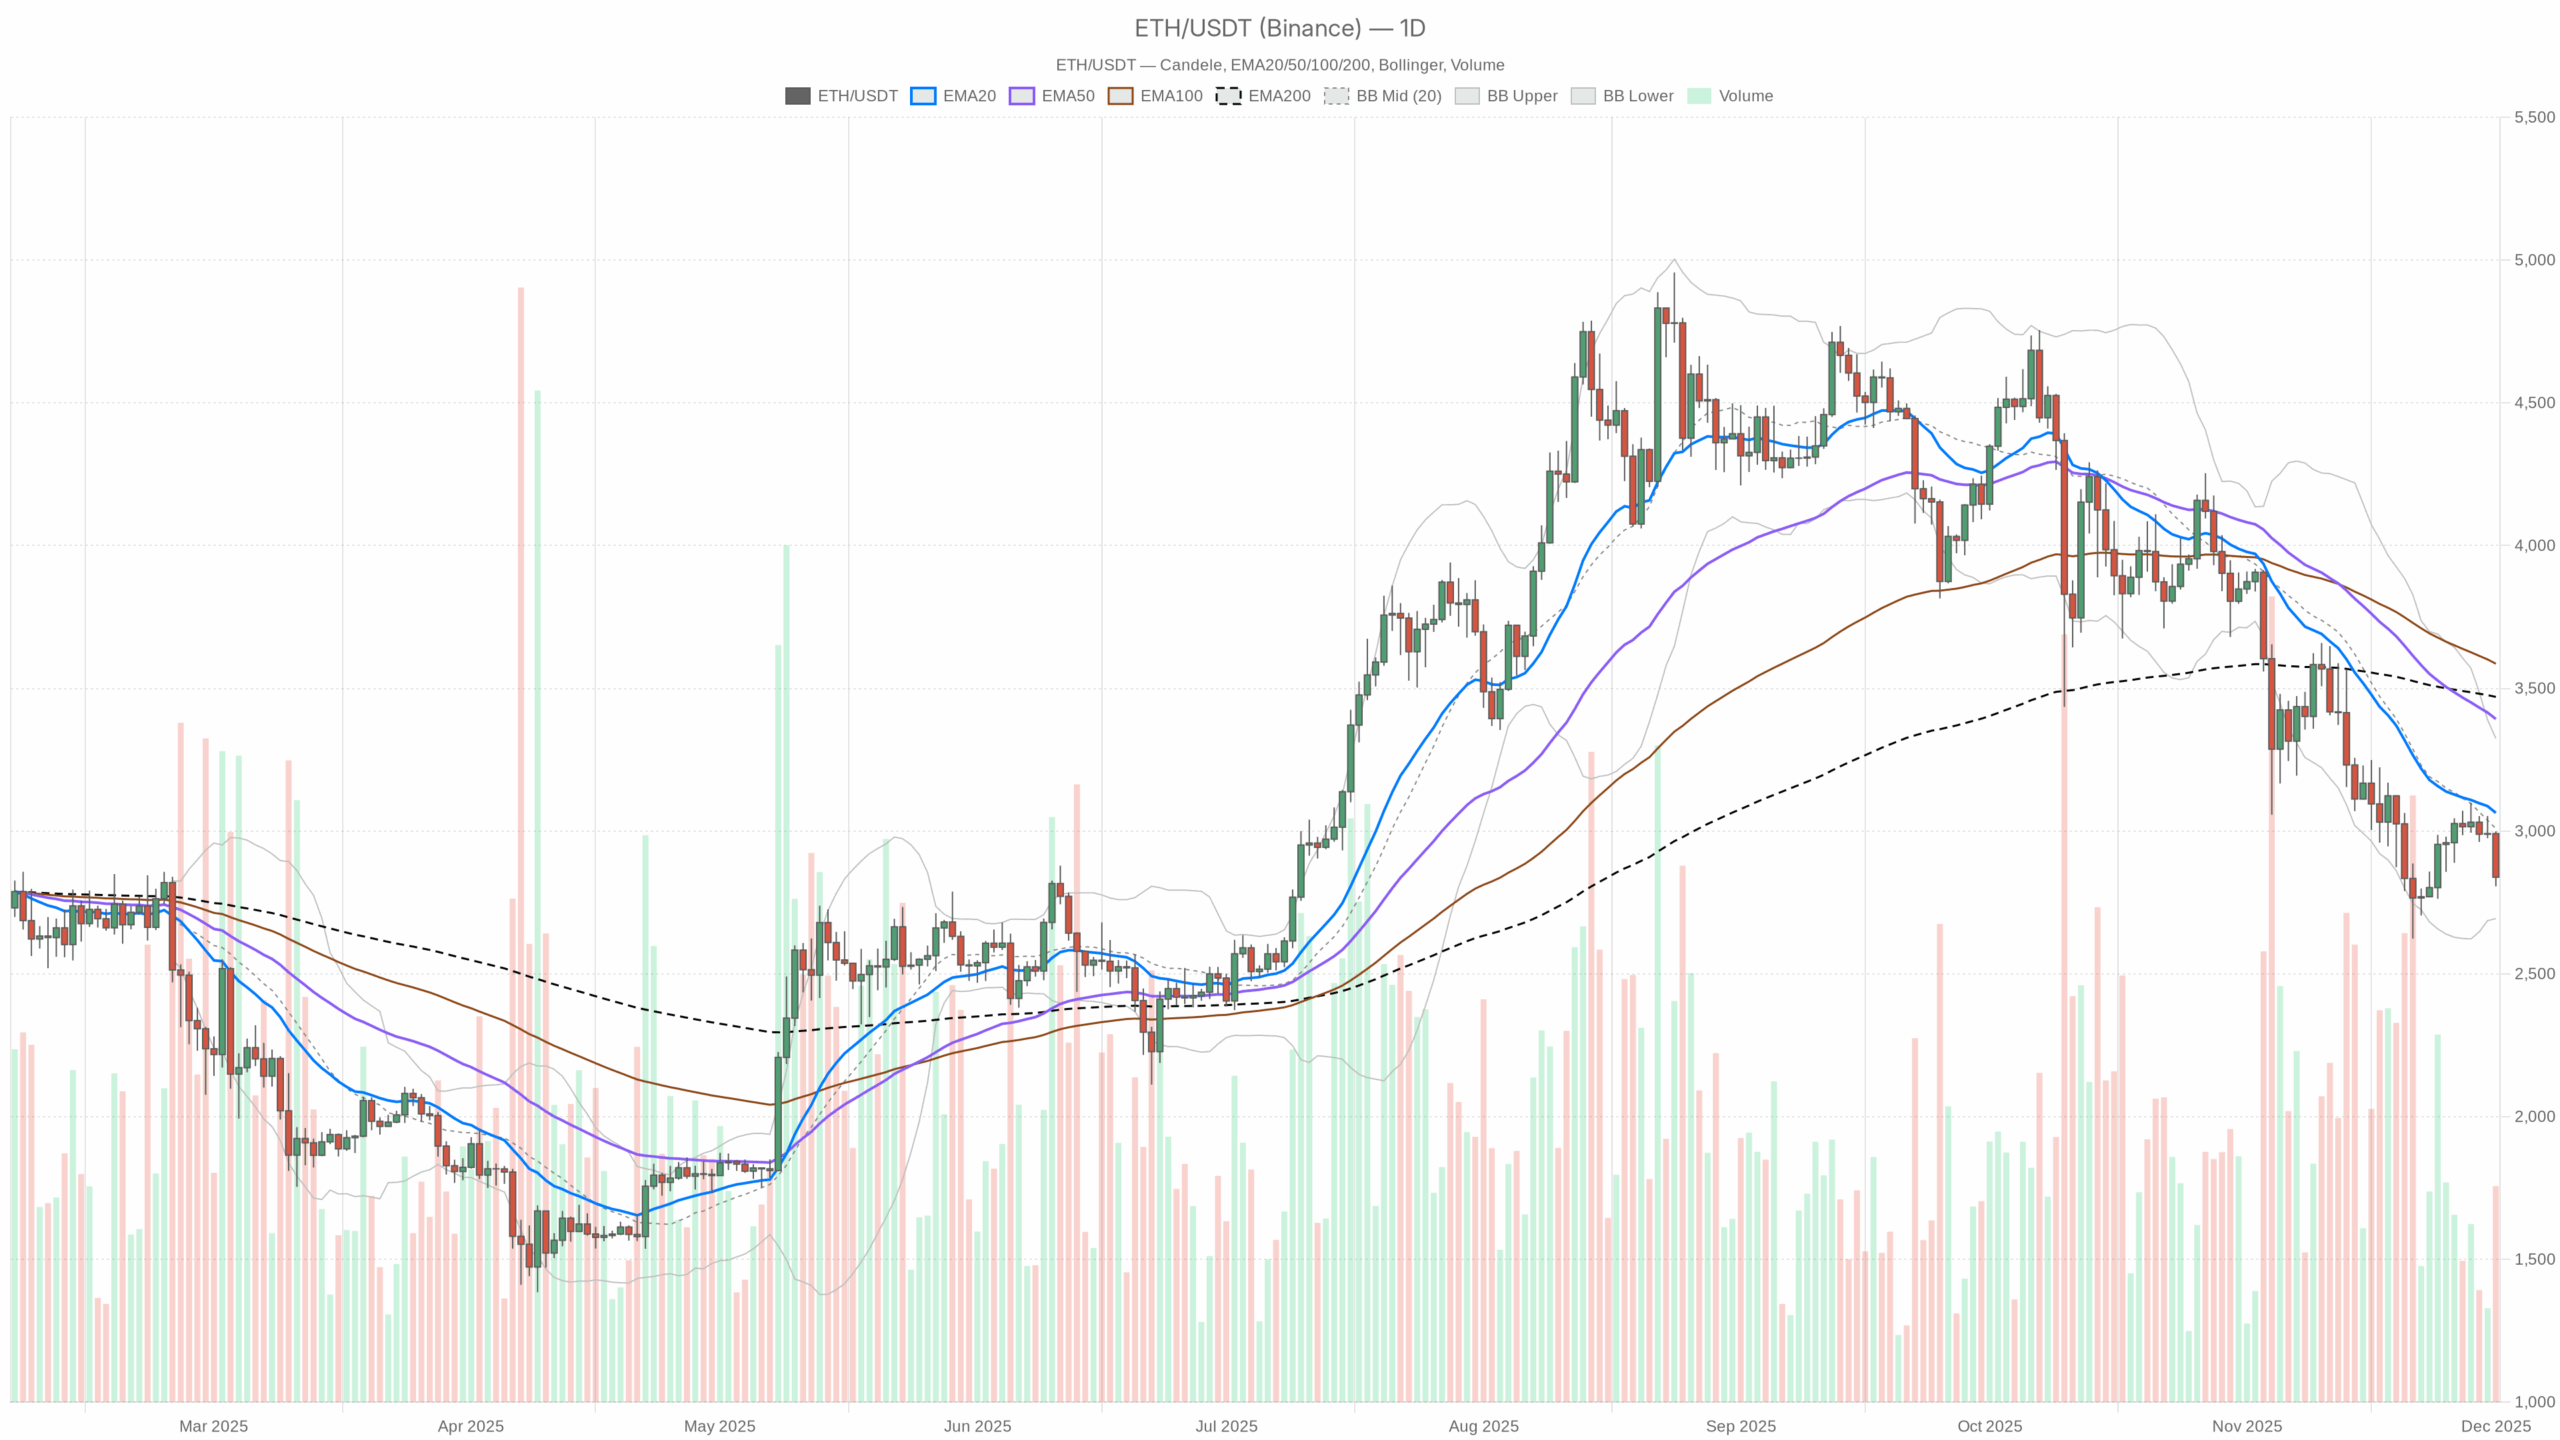 ETH/USDT — daily chart with candlesticks, EMA20/EMA50 and volume.
Summary about the Ethereum crypto sell off today
On the daily chart, ETHUSDT trades around 2838, clearly below its short, medium and long-term moving averages, which confirms a broad bearish regime. Momentum is weak but not yet exhausted, with the daily RSI sitting in the low 30s, close to classical oversold territory.
Moreover, the MACD remains negative, even if the histogram shows a modest attempt at stabilization. Volatility is elevated, as signaled by a high Average True Range, yet daily candles are still contained within the lower half of the Bollinger Bands. Market-wide, crypto capitalization has dropped about 5% in 24 hours, while Bitcoin dominance is above 57%, underlining a defensive rotation into the leader. With the Fear & Greed Index stuck in Extreme Fear at 24, sentiment suggests investors are risk-averse and quick to sell into any short-lived rallies.
Ethereum sell off crypto: Market Context and Direction
The broader backdrop is unambiguously risk-off. Global digital asset capitalization stands near 3.02 trillion dollars, but a 24-hour decline above 5% highlights the intensity of the latest wave lower. Bitcoin’s market dominance at roughly 57% shows that capital is clustering in the perceived safe haven of the sector, while Ethereum holds just over 11% of total value, a sign that altcoin exposure is being trimmed.
Moreover, the Fear & Greed Index reading of 24, labeled Extreme Fear, tells us that sentiment is deeply depressed. In such phases, investors often prefer to de-risk rather than attempt to catch falling knives, reinforcing the downward pressure on lagging majors like ETH. That said, extreme pessimism has historically coincided with the build-up of medium-term opportunities, as forced sellers eventually exhaust themselves.
Technical Outlook: reading the overall setup
On the daily timeframe, ETHUSDT is trading at 2838, well below the 20-day exponential moving average near 3064, the 50-day around 3393, and the 200-day close to 3470. This triple alignment, with price beneath all three, reinforces trend confirmation to the downside rather than a simple corrective pullback.
The daily RSI at about 34 underscores weakening momentum but stops short of classic oversold thresholds. This suggests sellers still control the tape, yet a momentum exhaustion window may be approaching if the indicator slips further into the 2030 band. Meanwhile, the MACD line is negative at roughly -159, but now sits slightly above its also-negative signal line, with a positive histogram. That small uptick hints at a tentative attempt to stabilize, though not yet a reliable reversal signal.
Bollinger Bands on the daily chart are centered around 3009, with the lower band near 2694 and the upper at 3324. Price is currently lodged in the lower half of this envelope, indicating that downside pressure remains dominant, but the fact that candles are not hugging the extreme lower band suggests the selloff is steady rather than a full-blown panic. ATR around 161 confirms elevated volatility, which often accompanies late-stage moves in a trend, where price swings become wider and stop placements more challenging.
Intraday Perspective and ETH crypto Momentum
On the hourly chart, the picture rhymes with the daily, but with extra short-term stress. Price near 2839 sits below the 20, 50 and 200-period EMAs at 2887, 2943 and 2964 respectively, revealing a firm bearish bias in the intraday structure. The hourly RSI is even weaker at roughly 29, pushing into oversold territory and warning that short-term downside could be stretched.
Meanwhile, the hourly MACD remains negative with the line under the signal and a slightly negative histogram, signaling that downward momentum intraday is still in play, even if the pace of the decline is slowing. The Bollinger Bands on this timeframe are wide, from about 2719 to 3086, with price stuck near the lower half. As a result, bears are still dictating direction, but the risk of sharp mean-reversion spikes higher increases every time the RSI dips further below 30.
On the 15-minute chart, price is hovering almost exactly at the 20-period EMA around 2839, though it remains below the 50 and especially the 200 EMA at nearly 2950. This suggests that very short-term flows are trying to stabilize, but they are doing so within a larger bearish market regime. The RSI on this micro timeframe sits near 47, almost neutral, and the MACD histogram is slightly positive, hinting at modest intraday relief after earlier selling waves.
Key Levels and Market Reactions
Pivot structures add useful color to this backdrop. On the daily chart, the central pivot point is around 2882, just above current prices. As long as ETHUSDT trades below this level, rallies are more likely to be viewed as opportunities to sell into strength rather than evidence of a durable bottom.
The first resistance area sits near 2956, aligning with the idea that any recovery into the high 2800s and low 2900s may attract renewed supply. In contrast, the first support sits closer to 2764, not far above the lower Bollinger Band region. A decisive break under this support could open the door toward the mid-2600s, confirming bearish continuation. However, if buyers manage to defend that zone and push price back above the daily pivot, it would strengthen the case for a short-covering rebound.
Future Scenarios and Investment Outlook
Overall, the main scenario remains bearish on the daily timeframe, with all key moving averages pointing down and price trading below them. Nevertheless, the combination of Extreme Fear sentiment, rising volatility and increasingly oversold intraday conditions hints that the most aggressive phase of the decline may be maturing.
For active traders, that means respecting the prevailing downtrend while staying alert to signs of volatility-driven reversal setups near key supports. Swing participants may prefer to wait for clearer evidence of a regime shift, such as a sustained break back above the 20-day EMA and a recovering RSI, before reassessing medium-term exposure. Long-term investors, meanwhile, might see this environment as an opportunity to scale in cautiously, aware that prices could probe lower supports before a durable base forms.
This analysis is for informational purposes only and does not constitute financial advice.
Readers should conduct their own research before making investment decisions.


You May Also Like

Super Micro Computer (SMCI) Stock Jumps 6% as Traders Bet Big on Calls

Solana soaks up $10.5b USDC as stablecoin rails go multi‑chain