

US Stock Indices Close Lower: Decoding Monday’s Market Pullback
BitcoinWorld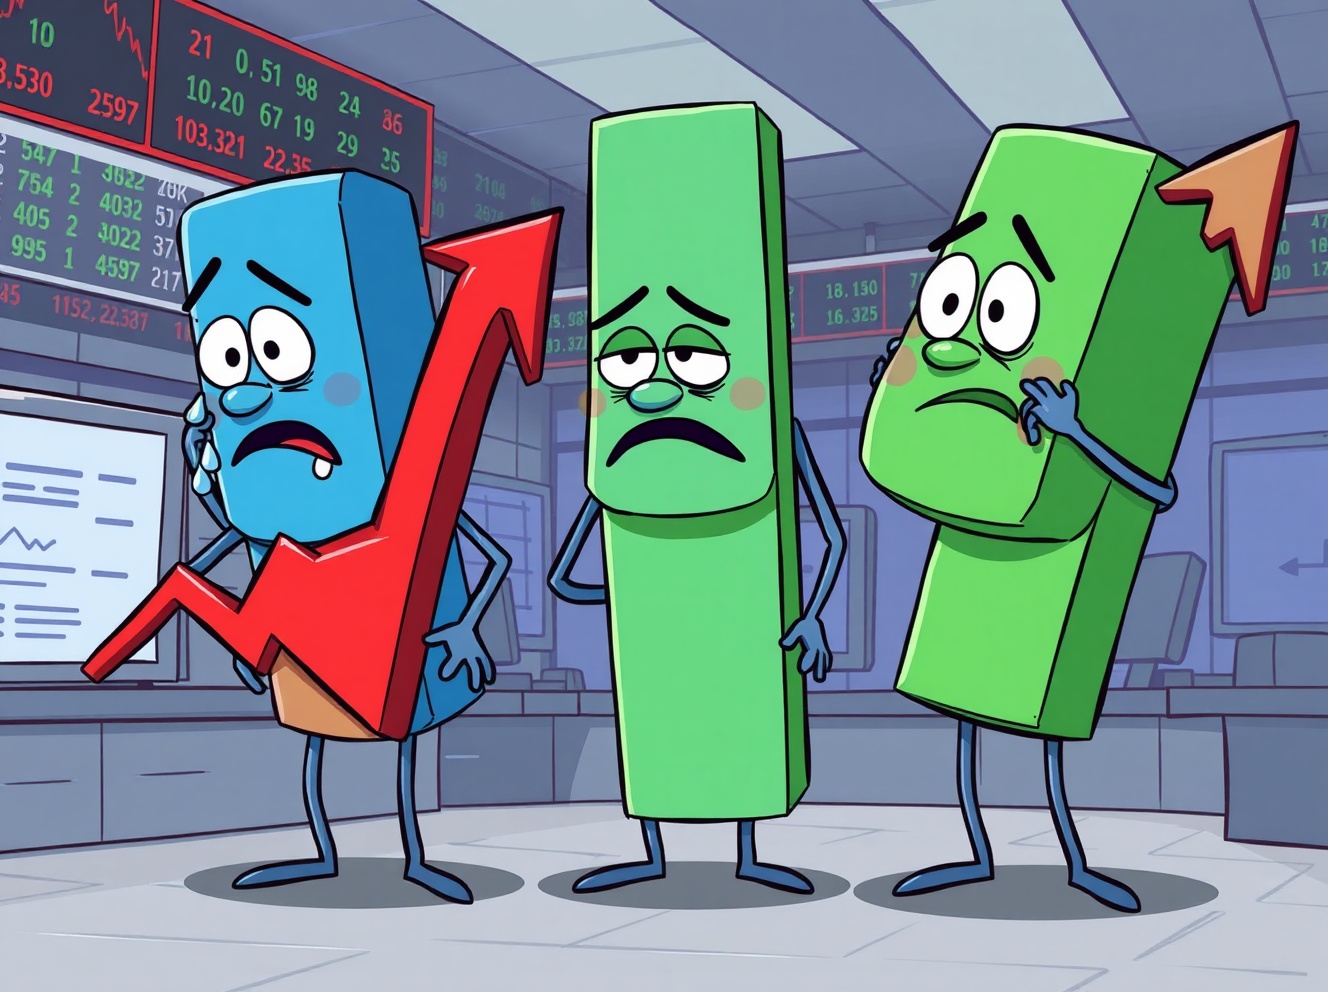
US Stock Indices Close Lower: Decoding Monday’s Market Pullback
If you watched the markets on Monday, you saw a sea of red. In a notable shift, the major US stock indices close lower, snapping recent momentum and putting investors on alert. This wasn’t a minor blip; the Dow Jones Industrial Average led the decline with a nearly 1% drop. Let’s unpack what drove this pullback and what savvy market participants should watch next.
Why Did US Stock Indices Close Lower on Monday?
The trading session wasn’t dominated by a single catastrophic event. Instead, a confluence of factors weighed on investor sentiment. Rising bond yields often make stocks less attractive by comparison, and concerns about the pace of future economic growth created a cautious atmosphere. Furthermore, profit-taking after recent gains is a typical market behavior. This combination prompted a broad-based retreat, confirming that the US stock indices close lower was a reaction to several underlying pressures.
A Closer Look at the Numbers: Which Index Fell the Most?
The declines were widespread, but not uniform. Understanding the breakdown is crucial for gauging market sector health.
- The Dow Jones Industrial Average dropped 0.89%, suffering the largest loss. This suggests traditional industrial and financial giants faced significant selling pressure.
- The S&P 500 fell 0.53%. As the broadest benchmark, this indicates a general market pullback affecting a wide range of companies.
- The Nasdaq Composite declined a relatively milder 0.38%. This hints that technology stocks showed slightly more resilience compared to other sectors.
This pattern tells us the sell-off had a particular impact on blue-chip and cyclical stocks, even as the tech-heavy Nasdaq held up a bit better.
What Does This Mean for Your Portfolio?
A single down day does not define a trend. However, when the US stock indices close lower in unison, it’s a clear signal for review. For long-term investors, such pullbacks can be normal volatility. For active traders, it may signal a shift in short-term momentum. The key is context: is this a healthy correction within a bull market, or the start of a deeper decline? Monitoring follow-through in the coming sessions is essential. Therefore, avoid panic selling based on one session, but do reassess your risk exposure.
Actionable Insights for Navigating Market Downturns
Market dips are inevitable. The question is how you respond. Here are practical steps:
- Review Your Asset Allocation: Ensure your portfolio’s mix of stocks, bonds, and other assets still matches your risk tolerance.
- Look for Quality Opportunities: A broad market decline can lower the price of strong companies, potentially creating entry points.
- Avoid Emotional Decisions: History shows that knee-jerk reactions to short-term drops often harm long-term returns.
Remember, the fact that US stock indices close lower on any given day is a feature of the market, not a bug. It’s part of the cycle.
Conclusion: Keeping Perspective on Market Movements
Monday’s session served as a stark reminder that markets don’t move in a straight line. The decline across the board was a collective pause, driven by a mix of technical and fundamental factors. While headlines focusing on the US stock indices close lower can sound alarming, informed investors see them as data points. The path forward depends on upcoming economic data, corporate earnings, and global events. Stay informed, stay diversified, and let a disciplined strategy guide you through both up and down days.
Frequently Asked Questions (FAQs)
Q: Is a single day where US stock indices close lower a reason to sell my investments?
A: Generally, no. Single-day movements are normal volatility. Making investment decisions based on one day is typically an emotional reaction. Review your long-term strategy instead.
Q: Which sector was hit the hardest when the US stock indices closed lower?
A: The significant drop in the Dow Jones suggests traditional sectors like industrials and financials faced more pressure than the technology-heavy Nasdaq Composite.
Q: Could this pullback be a buying opportunity?
A> It can be for disciplined investors. A market-wide dip can lower prices of quality stocks. However, thorough research on individual companies is crucial before buying.
Q: How often do all three major US indices close lower on the same day?
A> It’s a common occurrence. While not an everyday event, synchronized down days happen regularly as part of market cycles and are not inherently unusual.
Q: What should I monitor after a day like this?
A> Watch for follow-through in the next few sessions. Also, keep an eye on bond yields, key economic reports, and comments from the Federal Reserve for clues on market direction.
Found this analysis of why US stock indices close lower helpful? Market knowledge is power. Share this article with fellow investors on Twitter or LinkedIn to spark a smarter conversation.
To learn more about the latest financial market trends, explore our article on key developments shaping investor sentiment and future market outlook.
This post US Stock Indices Close Lower: Decoding Monday’s Market Pullback first appeared on BitcoinWorld.
You May Also Like

Siren (SIREN) Crashes 56% in 24 Hours Despite Strong Monthly Performance

Loopring (LRC) Price Prediction 2026-2030: Critical Analysis of Recovery Potential and Market Trajectory

