

The December Bitcoin Roadmap: The Signals You Can’t Ignore
Bitcoin has opened December 2025 on the back foot, and market structure around the new monthly candle is already drawing close scrutiny from traders.
How Will Bitcoin Perform In December?
Sharing a year-to-date chart on X, trader Daan Crypto Trades highlighted a recurring pattern in 2025: Bitcoin often sets its monthly extreme early. “We know by now that the first move does often create the monthly high or low within the first ~12 days,” he wrote. “This happens about 80% of the months.” His chart marks how February’s low, March’s high, April’s low, May’s low, July’s inflection, and the key October and November pivots all occurred within that window, with June and August flagged as exceptions.

December, so far, is conforming in form if not yet in outcome. “Price has taken a quick dive straight from the candle open so far in December, leaving no wick above either,” Daan noted. “This doesn’t make for the strongest high.” That kind of immediate one-sided move, he argues, is often revisited: “Good to watch closely in the 1–2 weeks ahead. Often these instant moves from the open, do end getting retested. October was a good example of that recently.”
Zooming in, Daan’s second chart sets out the key levels. After bottoming near $80,714 on November 21, Bitcoin staged roughly a +15% relief rally into a thick prior support-turned-resistance zone in the low-$93,000s. That first test failed, with price rejected and rolling back over.

“BTC rejecting from the previous support & resistance area,” he wrote. “Not something you want to see as a bull. Price saw a decent +15% relief rally but has lost steam again after a week already.” On that same chart he plots a short-term Fibonacci retracement from the $93,175 local high down to the $80,714 low. The 0.786 retracement level sits around $83,381, close to spot at the time of posting.
“It is early in the week/month,” he added, “and we do often see sharp moves straight from that new monthly candle. These often aren’t the strongest highs/lows set straight at the start of a new month. So good to watch in the days ahead. (You guys also know I love my .786 fib retests so watching closely around this area).”
That leaves a clear tactical map: immediate downside levels around the 0.786 retrace and the prior low, with upside conviction only returning if price can re-enter and reclaim the mid-to-high-$80,000s former support zone.
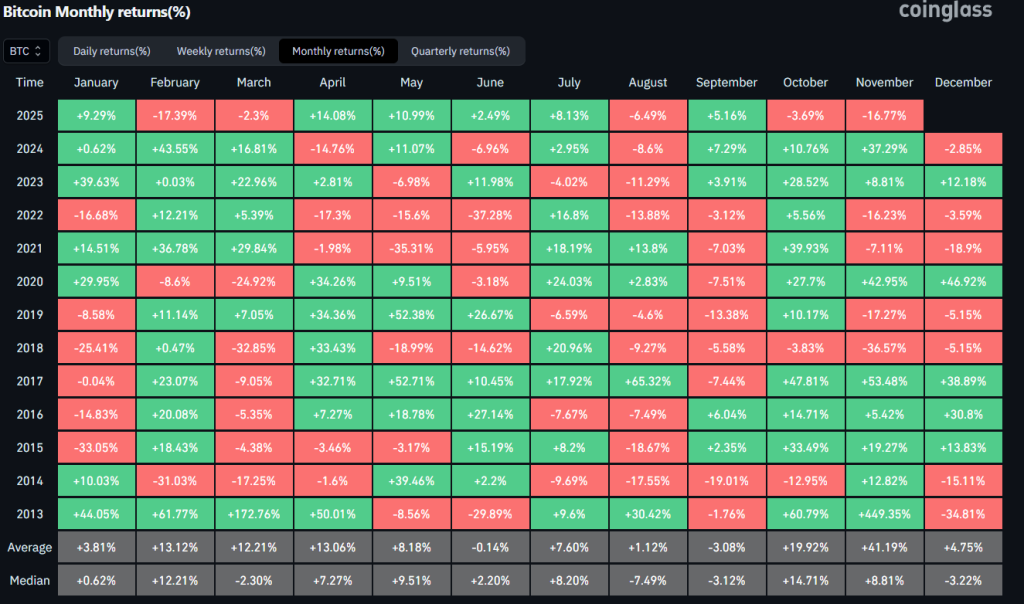
A separate post from Daan situates this setup within December’s broader historical profile. Sharing a Coinglass table of Bitcoin’s monthly returns from 2013 onward, he described December as “pretty mixed but [one that] has seen some big outliers with a lot of volatility.”
The data support that: past Decembers range from large gains above 30–40% to deep drawdowns exceeding -30%. The average December return sits in modest positive territory (+4.75%), while the median is slightly negative (-3.22%), underscoring that there is no simple “Santa rally” effect; instead, dispersion and volatility dominate.
For Daan, part of that behaviour is structural. “Don’t be surprised if you see some weird flows at the end and start of the year,” he warned. “Generally this is a period where large holders/funds and such rebalance their books. We might also see the effect of tax loss harvesting at some point.” Those portfolio adjustments and tax-driven trades can magnify moves in both directions, particularly in an asset that still trades with pockets of thin liquidity.
His practical takeaway is deliberately conservative: “Good to just be allocated in a way that feels comfortable for you. Whatever the end of 2025 and start of 2026 will bring.”
At press time, BTC traded at $87,323.

You May Also Like

Why Localization Services Matter for Software Companies

₹71L CoinDCX Fraud Case Turns, Court Finds No Link to Founders

