

XRP Price Nears Breakout Zone, Suggesting a Potential Rally May Be Brewing
XRP price started a recovery wave above $2.150. The price is now showing positive signs and might surge if it clears the $2.250 pivot level.
- XRP price started a recovery wave above the $2.120 zone.
- The price is now trading above $2.150 and the 100-hourly Simple Moving Average.
- There is a short-term contracting triangle forming with resistance at $2.20 on the hourly chart of the XRP/USD pair (data source from Kraken).
- The pair could continue to move up if it settles above $2.250.
XRP Price Eyes Upside Break
XRP price remained supported above $2.00 and started a recovery wave, like Bitcoin and Ethereum. The price was able to climb above $2.050 and $2.10 to enter a positive zone.
There was a clear move above the 61.8% Fib retracement level of the downward move from the $2.2750 swing high to the $1.9844 low. However, the price is now facing resistance near $2.220. There is also a short-term contracting triangle forming with resistance at $2.20 on the hourly chart of the XRP/USD pair.
The price is now trading above $2.150 and the 100-hourly Simple Moving Average. It seems to be consolidating near the 76.4% Fib retracement level of the downward move from the $2.2750 swing high to the $1.9844 low.
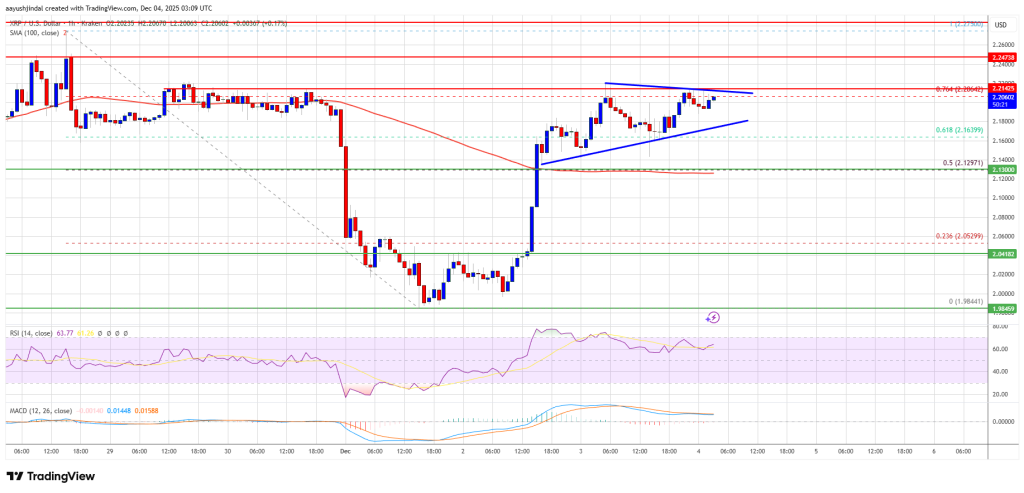
If there is a fresh upward move, the price might face resistance near the $2.20 level. The first major resistance is near the $2.220 level. A close above $2.220 could send the price to $2.250. The next hurdle sits at $2.350. A clear move above the $2.350 resistance might send the price toward the $2.40 resistance. Any more gains might send the price toward the $2.450 resistance. The next major hurdle for the bulls might be near $2.50.
Downside Correction?
If XRP fails to clear the $2.250 resistance zone, it could start a fresh decline. Initial support on the downside is near the $2.180 level. The next major support is near the $2.150 level.
If there is a downside break and a close below the $2.150 level, the price might continue to decline toward $2.10. The next major support sits near the $2.050 zone, below which the price could continue lower toward $2.00.
Technical Indicators
Hourly MACD – The MACD for XRP/USD is now gaining pace in the bullish zone.
Hourly RSI (Relative Strength Index) – The RSI for XRP/USD is now above the 50 level.
Major Support Levels – $2.180 and $2.150.
Major Resistance Levels – $2.220 and $2.250.
You May Also Like
The GOP’s secret weapon: A ‘known unknown’ that could swing the midterms

Shiba Inu (SHIB) Volume Falls 20%, Liquidity Crunch Coming?

