

Dogecoin Bulls Smell $1.30 As On-Chain Data Turns Red-Hot
Dogecoin is hovering near $0.15, but a cluster of technical and on-chain indicators shared on X suggests the market structure is far healthier than during the last bear phase, prompting fresh upside calls from analysts.
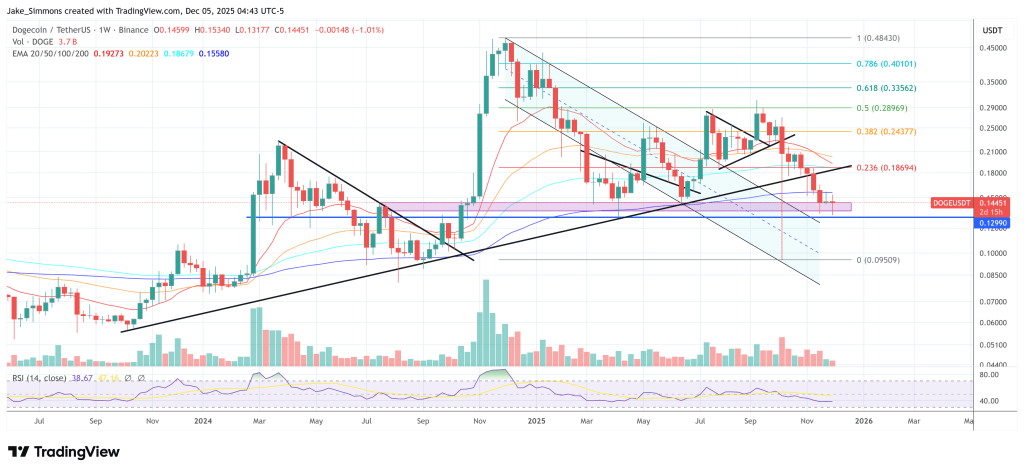
Dogecoin Could Target $1.30
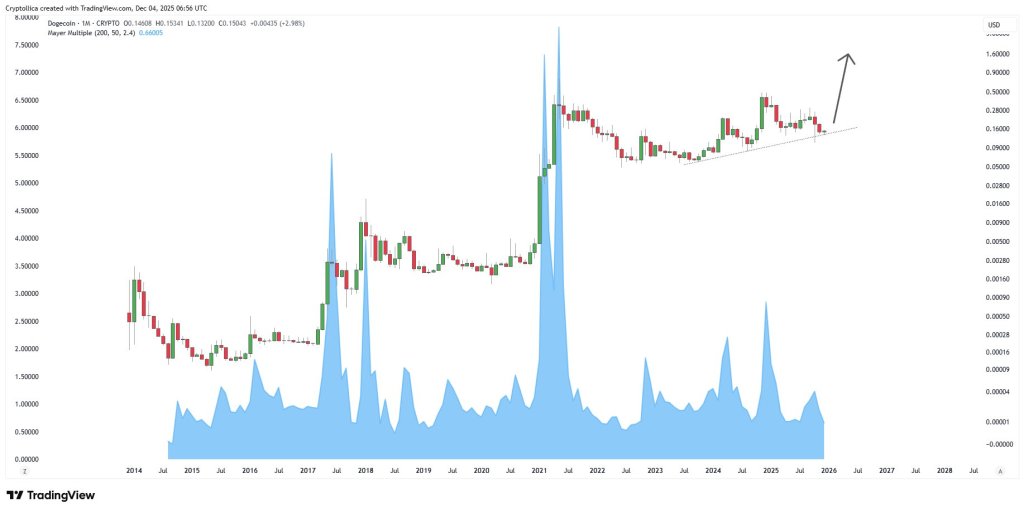
Trader Cryptollica posted a long-term monthly DOGE chart with the Mayer Multiple and a clear message: “DOGE Target > $1.30.” The Mayer Multiple, using 200- and 50-period moving averages with a 2.4 threshold, sits at 0.66005. Visually, that is far below the spikes above 5 that accompanied the 2017 and 2021 blow-off tops, indicating that Dogecoin is not yet in the overheated conditions historically associated with major market peaks.
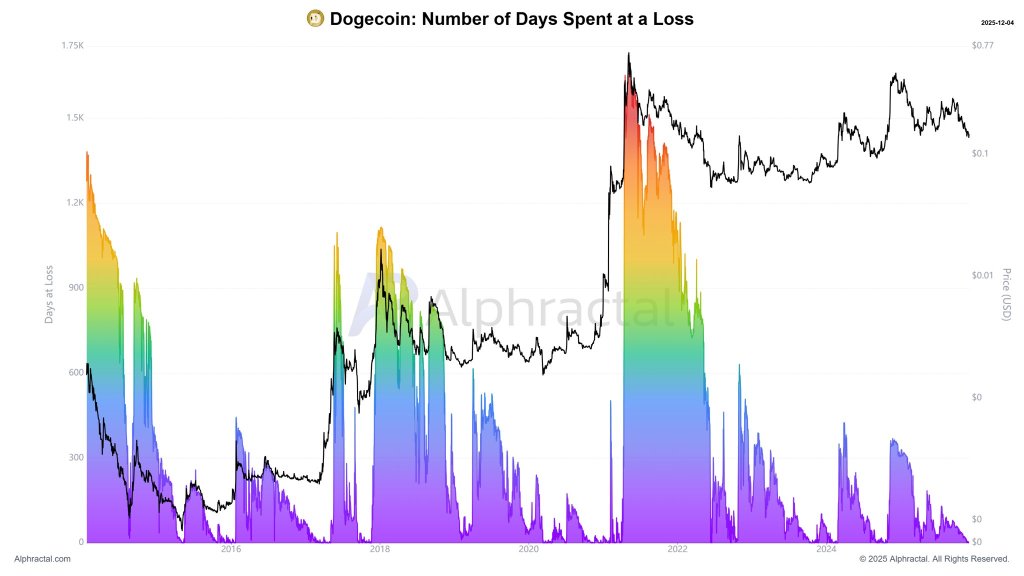
Cryptollica also highlighted an Alphractal chart titled “Dogecoin: Number of Days Spent at a Loss.” The series overlays DOGE’s price with a multicolour histogram of how long coins have been held in unrealised loss.
Earlier cycle lows around 2014–2015 and the post-2021 unwind show extended peaks above roughly 1,200–1,500 days at a loss. In the latest segment, that metric has compressed back toward the lower end of the scale, resembling the early reset phases that preceded previous advances, and signalling that the proportion of long-suffering holders has markedly declined.
DOGE On-Chain Data Looks Strong
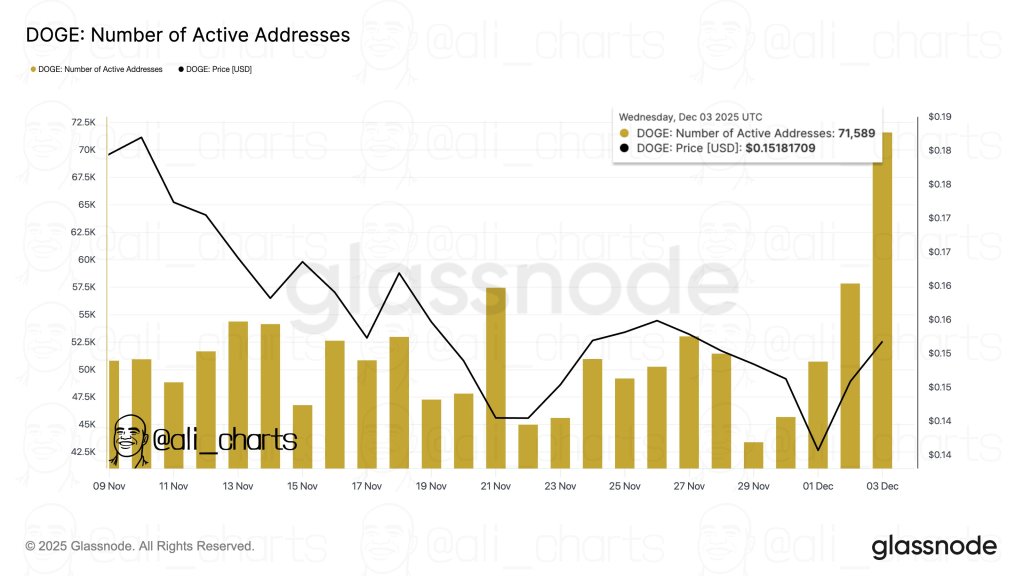
On the shorter-term on-chain side, Ali Martinez (@ali_charts) pointed to a sharp rebound in network activity. “Dogecoin just saw 71,589 active addresses. The biggest spike since September,” he wrote, sharing Glassnode data.
The chart “DOGE: Number of Active Addresses” plots daily active addresses as yellow bars against the DOGE price in black. From early November, activity ranged around 45,000–47,500 addresses while price drifted lower from about $0.17 to $0.14. On December 3, active addresses jumped to 71,589 as price recovered to $0.15181709, signalling a broadening of participation rather than a purely price-driven move.
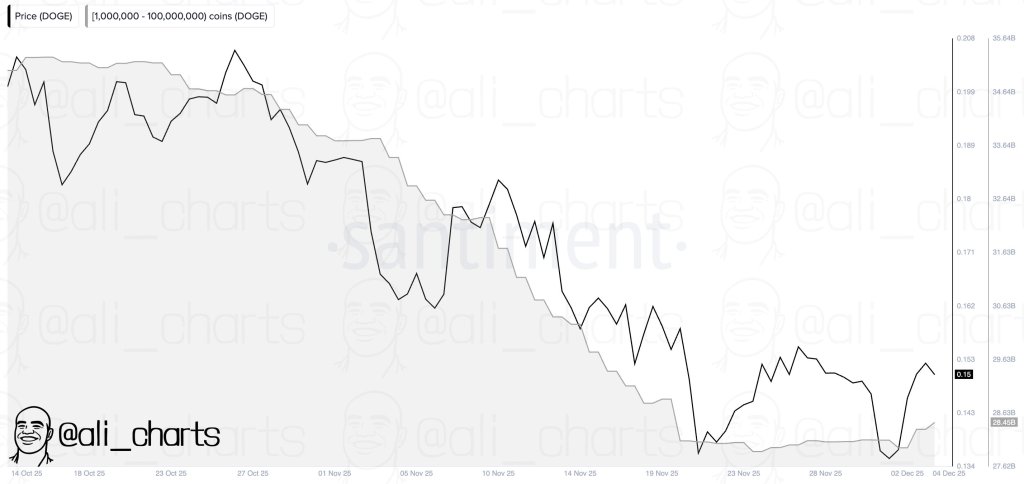
Ali also drew attention to whale behaviour. Posting a Santiment chart of balances held by addresses with between 1,000,000 and 100,000,000 DOGE, he noted: “480 million Dogecoin bought by whales in 48 hours!”
The grey area representing holdings in this band trends down from around 35.6 billion DOGE in mid-October to below 28 billion by late November while price falls from above $0.18 to about $0.135, indicating sustained distribution. In the final days of the chart, holdings rose again to roughly 28.45 billion as price rebounded from $0.14 to $0.15, confirming a renewed net accumulation phase among large holders.
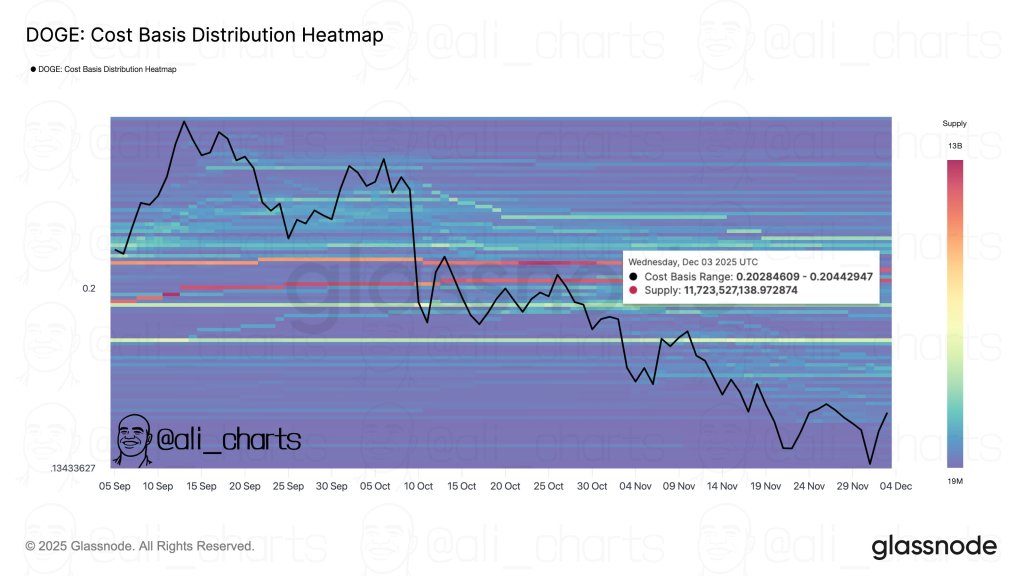
A third chart from Ali, “DOGE: Cost Basis Distribution Heatmap,” defines the next major technical hurdle. “$0.20 is the key resistance for Dogecoin. That’s where 11.72 billion $DOGE were accumulated,” he wrote.
The Glassnode heatmap highlights a dense band between $0.20284609 and $0.20442947, with an annotated supply of 11,723,527,138.97 DOGE whose on-chain cost basis lies in that range. This cluster marks a heavy realised-price node where a large volume of coins moves from loss to breakeven as spot revisits $0.20, creating a clearly defined resistance zone.
In combination, subdued valuation on the Mayer Multiple, a reset in “days at a loss,” the largest active-address spike since September, recent whale accumulation of 480 million DOGE and a well-defined $0.20 cost-basis wall form a favourable on-chain basis. Whether those higher levels are reached will depend on the market’s ability to absorb the 11.72 billion DOGE supply stacked around $0.20 and sustain the recent improvement in on-chain activity and large-holder demand.
At press time, DOGE traded at $0.14451.
You May Also Like

Fed cuts interest rates for first time in 2025

XAU/USD declines sharply to near $4,400 as Middle East fears revive


