

BNB Price Forecast: Can Binance Coin Reclaim $1,000 This December?
This article was first published on The Bit Journal.
The BNB price forecast for December now depends on a key struggle between a possible recovery and strong resistance near the crucial $1,000 level. $BNB has moved slightly higher after holding an important support zone.
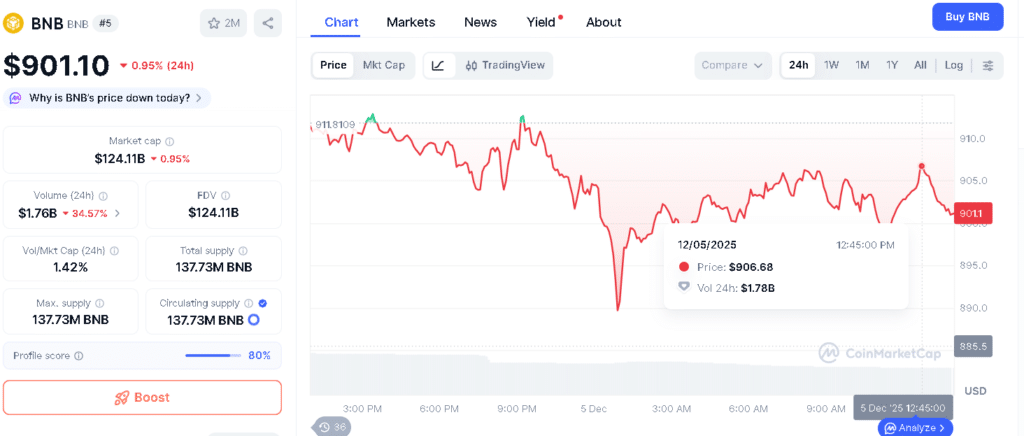
It is now trading around $905.03. However, analysts caution that several resistance areas, including $950 and the psychological $1,000 mark, could limit further gains. Market trends, liquidation levels, and weak on-chain activity are all influencing $BNB’s short-term movement.
What Is BNB and Why Does It Matter?
$BNB is the main utility token used within the Binance ecosystem. It is used for trading fee discounts, paying transaction fees on the BNB Chain, joining token launches, and making payments across a growing number of blockchain services.
Over time, $BNB has grown beyond just an exchange token and is now a key asset for decentralized apps, DeFi platforms, and cross-chain systems. Because of this wide use, the BNB price forecast often reflects both overall crypto market sentiment and investor confidence in the Binance platform.
Why Did BNB Fall Below the $1,000 Mark?
$BNB recently moved below the important $1,000 psychological level as weaker onchain activity and falling DEX volume reduced buying demand. A lower stablecoin supply across the network also tightened liquidity and added to the downside pressure.
 BNB Price Forecast: Can Binance Coin Reclaim $1,000 This December? 3
At the same time, changes in Binance’s leadership point to a shift away from aggressive growth toward a more balanced operating strategy. While this could help the platform over time, the short-term impact on the market remains unclear.
Adding to the cautious mood is the ongoing North Dakota lawsuit against Binance. Analysts believe this legal pressure could weigh on both the exchange’s outlook and the BNB price forecast in the near term.
How Important Is the $827 Support Level?
$BNB recently tested the $827 level, which had earlier acted as strong demand during August and September. Once again, that area held steady. Buyers stepped in at that point and stopped the price from falling further.
From a technical view, holding above $827 has given the market some short-term relief. Analysts see this level as a possible base for a temporary recovery. Still, the overall structure on the daily chart remains bearish, keeping pressure on the BNB price forecast despite the recent bounce.
Is $BNB showing early signs of a technical rebound?
Not quite, but there was an important technical development. $BNB is trading around $905.03, down 0.62% over the past 24 hours and lower by 4.38% over the past month. On the one-day chart, the token broke above a lower high at $906.5 on Wednesday, December 3.
This move shifted the internal market structure to a short-term bullish bias, even though the broader trend remains bearish. To the upside, the $950 zone stands out as a major obstacle.
This level served as a key trading battleground in November and is expected to offer stiff resistance again. Many analysts believe any move into this region will face heavy selling pressure, limiting upside in the current BNB price forecast.
| Metric | Value |
|---|---|
| Current Price | $905.03 |
| Key Support | $827 |
| Primary Resistance | $950 |
| Psychological Barrier | $1,000 |
| Uptrend Confirmation | $1,019 |
| Liquidation Cluster | $910-$920 |
| Technical Break | $906.5 |
| Indicators | DMI (ADX/-DI >20), CMF neutral |
What Do the Technical Indicators Reveal?
The Directional Movement Index continues to point to a strong bearish trend for $BNB, with both the ADX and the negative directional indicator staying above the 20 level. This shows that selling pressure still dominates the broader market trend.
At the same time, the Chaikin Money Flow indicator has remained close to neutral. This suggests that steady capital inflows have not yet returned. In simple terms, buyers are still hesitant even after the recent price bounce.
Low trading volume adds to this cautious outlook. It supports the view that the current move is more of a short-lived recovery rather than the start of a fresh bullish phase. For traders following the BNB price forecast, these signals suggest that caution is still warranted.
Why Is the Liquidation Map Drawing Attention?
Liquidation data is adding another important layer to the short-term outlook for $BNB. A large cluster of high-leverage liquidation levels is positioned between the $910 and $920 range. This makes the zone a likely near-term target as the price moves in search of liquidity.
Above that, the $950 level also holds a noticeable build-up of leveraged positions. What stands out is that short liquidations are both closer to the current price and larger in size than long liquidations.
This imbalance suggests that $BNB could move higher in the short term to force short sellers out of their positions before the broader downtrend resumes. This setup remains a key factor shaping near-term expectations within the BNB price forecast.
What Would Confirm a True Trend Reversal?
For bullish traders, the key level to watch is $1,000. This is not only a round number but also a major psychological barrier. Analysts widely agree that only a daily close above $1,000 would signal true market acceptance at higher levels.
Beyond that, $1,019 stands out as an important swing high from November. A clear break above this level would be needed to confirm a fresh uptrend. Until both of these levels are crossed, any recovery is likely to be seen as a temporary bounce rather than the start of a lasting bullish phase in the BNB price forecast.
Are Traders Preparing for a Short Squeeze?
Market analysts believe the broader bearish trend still remains in place. The lack of strong buying pressure, confirmed by the CMF and muted trading volume, supports the view that the current rally is corrective rather than the start of a new uptrend.
 BNB Price Forecast: Can Binance Coin Reclaim $1,000 This December? 4
They note that any move toward the $950 to $1,000 range could present short-selling opportunities instead of signaling a confirmed breakout. With liquidation clusters building above current levels, traders appear to be preparing for a possible short squeeze before the wider downtrend continues.
For short-term participants, careful risk management remains essential under the current BNB price forecast.
Conclusion
The BNB price forecast remains under pressure in the near term as $BNB continues to face a tough recovery path. The token slipped below the $1,000 level after on-chain activity, DEX volume, and stablecoin supply weakened across the network.
Although the defense of the $827 support zone has opened the door to a rebound attempt, the path higher remains crowded with resistance. A push toward $950 and possibly into the $910 to $920 liquidity zone appears likely, especially given the imbalance in leveraged short positions.
However, without strong buying demand and a clear breakout above both $1,000 and $1,019, the broader bearish bias remains in place. For now, the BNB price forecast points to a recovery that is possible but difficult.
Sustained demand will be the deciding factor. Until that happens, traders are expected to remain cautious and defensive as December unfolds.
Glossary
On-Chain Activity: Every transaction logged right on the blockchain.
Liquidation Cluster: Price spots where tons of leveraged bets auto-close.
DEX Volume: Total trades buzzing on decentralized exchanges.
Short Squeeze: Fast price jump that makes short sellers rush to buy back.
Psychological Level: Round prices like $1,000 that everyone watches closely.
Frequently Asked Questions About BNB Price Forecast
Why does BNB matter?
BNB is used widely in Binance, DeFi, and cross-chain apps, so its price reflects overall crypto market trends.
Why did BNB fall below $1,000?
BNB fell below $1,000 because trading activity dropped, on-chain activity was weak, and stablecoin supply decreased.
Is BNB bullish now?
BNB is not fully bullish yet; it shows a small short-term rise, but the main trend is still downward.
What are the main resistance levels for BNB?
The main resistance levels are $950 and $1,000, where selling pressure could slow or reverse price gains.
What level would confirm a true uptrend?
A daily close above $1,000 and then above $1,019 would signal a confirmed uptrend for BNB.
Sources
AMBCrypto
CoinMarketCap
Read More: BNB Price Forecast: Can Binance Coin Reclaim $1,000 This December?">BNB Price Forecast: Can Binance Coin Reclaim $1,000 This December?
You May Also Like

Nvidia Faces Class Action Over Alleged Hidden Crypto GPU Revenue

Ethereum koers toont zeldzaam dubbel koopsignaal en richt zich op $4.550


