

Toncoin (TON) Price Prediction 2025–2029: Can TON Break Above $2.00 Soon?
- Toncoin stabilizes near $1.58, buyers defending short-term support levels.
- AlphaTON raises $420M, but Toncoin’s liquidity outflows limit price action.
- Toncoin trapped beneath moving averages, eyes breakout above $1.62 resistance.
Toncoin’s (TON) price is stabilizing at around $1.58 after experiencing a significant decline over the past few months. Despite breaking major support levels earlier in the quarter, including both horizontal support and trendline structure, there is a glimmer of hope for the bulls. Price action in recent sessions indicates that buyers are attempting to establish a base and defend short-term support levels. However, Toncoin remains beneath key moving averages and trapped within a well-defined downward channel, making its next moves crucial to determining the future direction.
Also Read: XRP Price Prediction for December 7: Sellers Continue to Dominate as Weak Momentum Persists
Toncoin’s recent rally attempts coincide with AlphaTON Capital’s surprise announcement of a fundraising plan totaling $420.69 million, a move designed to draw attention and generate excitement. However, while AlphaTON’s stock price surged by 14.7% following the announcement, market participants are cautious, with net flows into Toncoin remaining weak. Despite AlphaTON holding over $20 million worth of TON tokens, the broader TON ecosystem has seen persistent outflows in recent months.
Toncoin Price Action: Will the Downtrend Continue or Will Buyers Take Control?
Toncoin’s price remains locked beneath a key declining trendline that dates back to early September, following a rejection at $2.70. Since then, Toncoin has formed a steady downtrend characterized by lower highs and lower lows. This downtrend accelerated in October, with a violent selloff pushing the price into a steeper decline channel.
Recent attempts to stabilize near the $1.44–$1.52 zone have failed to gain substantial upward momentum. As a result, the price remains constrained by a cluster of descending moving averages. These moving averages—specifically the 20-day EMA at $1.59, the 50-day EMA at $1.76, and the 100-day EMA at $1.90—have consistently rejected any rally attempts. The 200-day EMA at $2.69 remains the major hurdle that must be cleared to shift the trend from defensive to constructive.
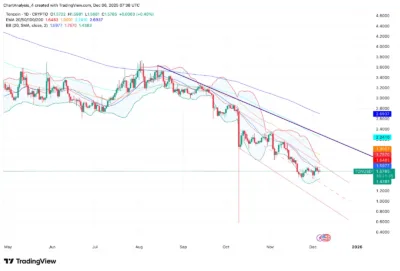
Source: Tradingview
Technical Analysis: A Strong Base or a Trapped Asset?
On the 30-minute chart, Toncoin is showing signs of compression within a symmetrical triangle, with the price hovering around $1.60–$1.62, the upper boundary of the triangle. This type of chart setup often results in a breakout, but the market is currently in a tug-of-war, with neither the bulls nor the bears able to establish clear dominance. Despite this, the Parabolic SAR indicator remains below the price, which suggests a slight upward bias in the short term.
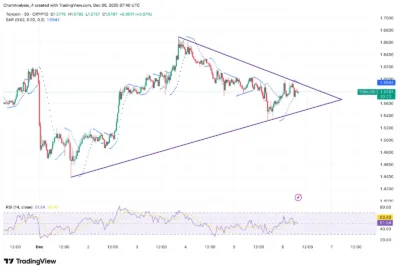
Source: Tradingview
However, the fragile nature of the trend is evident, as the Parabolic SAR is not forming a strong, clear trend, indicating that any breakout attempt may lack momentum. A break above $1.62 would be required to signal the start of a more sustainable rally. If the price fails to clear this resistance, it risks coiling further, building energy for a future breakout but without clear direction.
Short-Term Momentum: Neutral with Caution
The Relative Strength Index (RSI) for Toncoin currently sits at 51, indicating neutral momentum. This reflects a market that is not yet overbought or oversold but is showing signs of hesitation. The lack of strong momentum either way highlights the indecision among traders, and the coming days will be crucial in determining whether Toncoin can establish a new bullish trend or face further consolidation.
Weak Market Flows: Liquidity Outflows Continue
Toncoin’s ecosystem has seen persistent outflows, with data from Coinglass showing a net outflow of -$252,000 on December 5. This follows a broader pattern of weak liquidity flows throughout the quarter. Despite AlphaTON’s announcement, the market reaction has been subdued, and Toncoin’s liquidity remains fragile. For the bullish thesis to hold, Toncoin will need to reverse the current outflow trend and attract renewed capital inflows.
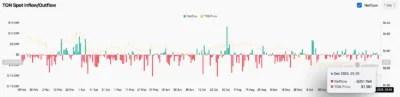
Source: Coinglass
Bullish and Bearish Scenarios for Toncoin (TON)
For Toncoin to rally, it must break above the key resistance level of $1.62, followed by a push towards the 50-day EMA at $1.76. A surge in volume would be required to fuel a move towards the 100-day EMA at $1.90, and eventually to test the 200-day EMA at $2.69. A break and hold above $2.69 would shift the trend from defensive to constructive, signaling the potential for further upside.
If Toncoin fails to break above $1.62 and the market continues to show weak liquidity, the price may break below the $1.52 support. A failure to hold above this level could result in a decline towards $1.44 and, potentially, a deeper correction towards $1.30–$1.20, as the downward channel continues to dominate the market. Persistent outflows would increase the downside risk, making a bearish scenario more likely.
Toncoin (TON) Price Prediction 2025–2029
| Year | Minimum Price | Average Price | Maximum Price |
|---|---|---|---|
| 2025 | $1.40 | $1.60 | $2.00 |
| 2026 | $1.50 | $1.80 | $2.30 |
| 2027 | $1.60 | $2.00 | $2.50 |
| 2028 | $1.70 | $2.20 | $2.80 |
| 2029 | $1.80 | $2.40 | $3.00 |
2025 Outlook
Toncoin enters 2025 with a delicate market structure. The price is stuck beneath important moving averages and key trendlines, and while there are signs of stabilization, the market remains weak. If Toncoin can break above $1.62 and hold this level, it could target $1.76–$1.90 by the end of 2025, with the $2.00 resistance standing as the major hurdle.
2026–2027 Projections
If Toncoin manages to sustain a bullish breakout in 2025, the market could push towards $2.30–$2.50 by 2026, with further growth expected if the broader cryptocurrency market cycles positively. By 2027, Toncoin could reach the $2.50 range, depending on its adoption and use cases within the TON ecosystem.
2028–2029: Long-Term Potential
By 2028, Toncoin could aim for the $2.80 range, and by 2029, it could approach $3.00 if the ecosystem continues to gain traction and the broader crypto market sees sustained bullish cycles.
Conclusion
Toncoin (TON) remains trapped beneath key moving averages and a declining trendline, leaving the market in a neutral position. However, there are attempts to stabilize, and if buyers can successfully break through resistance levels, Toncoin could be poised for a move towards the $2.00 mark. Without a significant change in liquidity flows, though, the risks of further downside remain.
FAQs
1. Why has Toncoin price been struggling recently?
Toncoin’s price has faced downward pressure due to persistent outflows, resistance at key moving averages, and a broader market decline in the digital asset sector.
2. Is Toncoin oversold?
Toncoin is not oversold at the moment, with the RSI sitting at neutral levels. This suggests that the market has not yet hit extreme conditions.
3. What is the next key resistance for Toncoin?
The next key resistance for Toncoin is at $1.62, followed by the 50-day EMA at $1.76. A break above these levels could indicate the beginning of a bullish move.
4. Can Toncoin reach $2.00 by 2025?
Yes, if Toncoin can break above the $1.62 resistance and sustain momentum, it could reach the $2.00 mark by the end of 2025.
5. What is Toncoin’s long-term outlook?
Toncoin’s long-term outlook remains positive, with the potential for gradual growth, especially if liquidity inflows improve and the broader cryptocurrency market trends upward. By 2029, Toncoin could reach as high as $3.00 if current market conditions persist.
Also Read: Ethereum Classic (ETC) Price Prediction 2025–2029: Can ETC Hit $20 Soon?
The post Toncoin (TON) Price Prediction 2025–2029: Can TON Break Above $2.00 Soon? appeared first on 36Crypto.
You May Also Like

Trump Policy Has Crypto Privacy Developers in a ‘Very Bad State’, Says Coin Center

Eric Trump Unlocks A Revolutionary Strategy


