Bitcoin (BTC) Price Prediction 2026, 2027-2030
- Bullish BTC price prediction for 2026 is $94,918.01 to $107,431.38.
- Bitcoin (BTC) price might reach $200,000 soon.
- Bearish (BTC) price prediction for 2026 is $73,879.76.
In this Bitcoin (BTC) price prediction for 2026, 2027-2030, we will analyze the price patterns of BTC by using accurate trader-friendly technical analysis indicators and predict the future movement of the cryptocurrency.
|
TABLE OF CONTENTS
|
|
INTRODUCTION
|
|
|
BITCOIN (BTC) PRICE PREDICTION 2026
|
|
| BITCOIN (BTC) PRICE PREDICTION 2027, 2028-2030 |
| CONCLUSION |
| FAQ |
Bitcoin (BTC) Current Market Status
| Current Price | $93,732.86 |
| 24 – Hour Price Change | 0.87% Up |
| 24 – Hour Trading Volume | $45.53B |
| Market Cap | $1.87T |
| Circulating Supply | 19.97M BTC |
| All – Time High | $126,198.07 (On October 07, 2025) |
| All – Time Low | $0.04865 (On Jul 15, 2010) |
What is Bitcoin (BTC)?
| TICKER | BTC |
| BLOCKCHAIN | Bitcoin |
| CATEGORY | Bitcoin |
| LAUNCHED ON | January 2009 |
| UTILITIES | Store of value |
Bitcoin (BTC) is the original decentralized digital currency created by the pseudonymous founder(s) Satoshi Nakamoto in 2009, introducing the concept of blockchain technology. BTC utilizes a peer-to-peer network and operates on a proof-of-work (PoW) consensus, where validators secure transactions through energy-intensive “mining.” The cryptocurrency has a fixed supply cap of 21 million BTC, with less than 1.35 million BTC remaining to be mined as of February 2024.
Bitcoin has shown a significant transformative journey since its inception. From being the first cryptocurrency to gaining widespread recognition, it has become a dominant force in the global financial landscape. Bitcoin holds the title of the “largest cryptocurrency” by market capitalization, and its adoption has expanded into various sectors, from retail to education and the introduction of real-world Bitcoin ATMs.
Bitcoin has recently gained mainstream attention, experiencing widespread adoption following Donald Trump’s victory in the U.S. presidential election. The cryptocurrency has been reaching new highs daily, as the U.S. administration under Trump plans to adopt “Bitcoin as a reserve currency.” Additionally, Trump has promised to make America the global crypto capital, signaling strong support for the pro-crypto agenda.
Bitcoin 24H Technicals
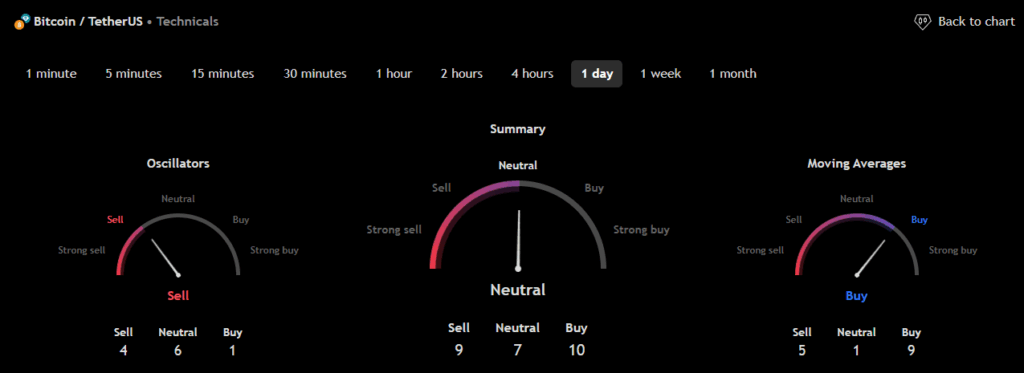 (Source: TradingView)
Bitcoin (BTC) Price Prediction 2026
Bitcoin (BTC) ranks 1st on CoinMarketCap in terms of its market capitalization. The overview of the Bitcoin price prediction for 2026 is explained below with a daily time frame.
In the above chart, Bitcoin (BTC) laid out an Ascending Triangle pattern. The ascending triangle is a characteristic pattern of an ongoing bullish trend. This triangle is formed by a horizontal upper trendline that connects the highs, indicating a consistent level of resistance, and a lower trendline that connects the rising lows, reflecting increasing buying pressure.
As the price approaches the apex of the triangle, the tension between buyers and sellers intensifies. If the trend breaks out at the resistance level, the price will continue to move up in this ascending triangle pattern, often leading to further gains. Traders typically look for confirmation of the breakout, which can enhance the likelihood of a successful upward move.
Contrary to popular belief, a descending triangle can be bullish or bearish. A regular descending triangle pattern is traditionally regarded as a bearish chart pattern. A descending triangle pattern, on the other hand, can be bullish.
At the time of analysis, the price of Bitcoin (BTC) was recorded at $93,732.86. If the trend continues, the price of BTC may reach the resistance levels of $95,698.91 and $113,236.85. If the trend reverses, then the price of BTC may fall to the support levels of $86,918.21 and $80,227.33.
Bitcoin (BTC) Resistance and Support Levels
The chart given below elucidates the possible resistance and support levels of Bitcoin (BTC) in 2026.
From the above chart, we can analyze and identify the following as resistance and support levels of Bitcoin (BTC) for 2026.
| Resistance Level 1 | $94,918.01 |
| Resistance Level 2 | $107,431.38 |
| Support Level 1 | $83,559.05 |
| Support Level 2 | $73,879.76 |
BTC Resistance & Support Levels
Bitcoin (BTC) Price Prediction 2026 — RVOL, MA, and RSI
The technical analysis indicators such as Relative Volume (RVOL), Moving Average (MA), and Relative Strength Index (RSI) of Bitcoin (BTC) are shown in the chart below.
From the readings on the chart above, we can make the following inferences regarding the current Bitcoin (BTC) market in 2026.
| INDICATOR | PURPOSE | READING | INFERENCE |
| 50-Day Moving Average (50MA) | Nature of the current trend by comparing the average price over 50 days | 50 MA = $89,387.86Price = $93,734.25 (50MA < Price) |
Bullish/Uptrend |
| Relative Strength Index (RSI) | Magnitude of price change;Analyzing oversold & overbought conditions | 64.54 <30 = Oversold 50-70 = Neutral>70 = Overbought |
Neutral |
| Relative Volume (RVOL) | Asset’s trading volume in relation to its recent average volumes | Above cutoff line | Strong Volume |
Bitcoin (BTC) Price Prediction 2026 — ADX, RVI
In the below chart, we analyze the strength and volatility of Bitcoin (BTC) using the following technical analysis indicators — Average Directional Index (ADX) and Relative Volatility Index (RVI).
From the readings on the chart above, we can make the following inferences regarding the price momentum of Bitcoin (BTC).
| INDICATOR | PURPOSE | READING | INFERENCE |
| Average Directional Index (ADX) | Strength of the trend momentum | 19.87 | Weak Trend |
| Relative Volatility Index (RVI) | Volatility over a specific period | 62.43 <50 = Low >50 = High |
High Volatility |
Comparison of BTC with ETH
Let us now compare the price movements of Bitcoin (BTC) with that of Ethereum (ETH).
From the above chart, we can interpret that the price action of BTC and ETH are seen to exhibit similar trajectories.
Bitcoin (BTC) Price Prediction 2027, 2028 – 2030
With the help of the aforementioned technical analysis indicators and trend patterns, let us predict the price of Bitcoin (BTC) between 2027, 2028, 2029, and 2030.
| Year | Bullish Price | Bearish Price |
| Bitcoin (BTC) Price Prediction 2027 | $202,000 | $74,000 |
| Bitcoin (BTC) Price Prediction 2028 | $204,000 | $70,000 |
| Bitcoin (BTC) Price Prediction 2029 | $207,130 | $65,000 |
| Bitcoin (BTC) Price Prediction 2030 | $210,000 | $60,000 |
Conclusion
In conclusion, the bullish Bitcoin (BTC) price prediction for 2026 is $107,431.38. Comparatively, if unfavorable sentiment is triggered, the bearish Bitcoin (BTC) price prediction for 2026 is $73,879.76.
If the market momentum and investors’ sentiment positively elevate, then Bitcoin (BTC) might hit $200,000. Furthermore, with future upgrades and advancements in the Bitcoin ecosystem, BTC might surpass its current all-time high (ATH) of $126,198.07 and mark its new ATH.
FAQ
1. What is Bitcoin (BTC)?
BTC is the world’s largest cryptocurrency built on the peer-to-peer blockchain network Bitcoin. It was launched in 2009.
2. Where can you buy Bitcoin (BTC)?
Traders can trade Bitcoin (BTC) on almost all crypto exchanges or virtual asset trading platforms.
3. Will Bitcoin (BTC) record a new ATH soon?
With the ongoing upgrades within the Bitcoin ecosystem and positive regulatory moves, Bitcoin (BTC) has a high possibility of marking its new ATH soon.
4. What is the current all-time high (ATH) of Bitcoin (BTC)?
Bitcoin (BTC) hit its current all-time high (ATH) of $126,198.07 on October 07, 2025.
5. What is the lowest price of Bitcoin (BTC)?
According to CoinMarketCap, BTC hit its all-time low (ATL) of $0.04865 on July 15, 2010.
6. Will Bitcoin (BTC) hit $200,000?
If Bitcoin (BTC) becomes one of the active cryptocurrencies that majorly maintain a bullish trend, it might rally to hit $200,000 soon.
7. What will be the Bitcoin (BTC) price by 2027?
Bitcoin (BTC) price might reach $202,000 by 2027.
8. What will be the Bitcoin (BTC) price by 2028?
Bitcoin (BTC) price might reach $204,000 by 2028.
9. What will be the Bitcoin (BTC) price by 2029?
Bitcoin (BTC) price might reach $207,130 by 2029.
10. What will be the Bitcoin (BTC) price by 2030?
Bitcoin (BTC) price might reach $210,000 by 2030.
Top Crypto Predictions
dogwifhat (WIF) Price Prediction
OKB (OKB) Price Prediction
Bitget Token (BGB) Price Prediction
Disclaimer: The opinion expressed in this article is solely the author’s. It does not represent any investment advice. TheNewsCrypto team encourages all to do their own research before investing.
You May Also Like

Republican claims GOP leaders ignored him years ago about colleague's sex scandal

Next Dogecoin: BTC Miners Dump 15,000 Coins as Pepeto Builds What DOGE Never Had