

Ethereum Loses Momentum While OI Holds Steady: Binance Data Shows A Market Reset
Ethereum has reclaimed the $3,150 level after a volatile Sunday session that left traders divided on what comes next. Some analysts warn that ETH’s recent bounce is nothing more than a temporary pause before the downtrend resumes, while others see signs of a potential bullish reversal forming at current levels.
Fresh data from Binance reveals that Ethereum is now entering a delicate phase. Price momentum has clearly weakened, yet open interest remains relatively high despite the decline from the $3,900 region. This disconnect highlights a major shift in futures market behavior: traders are holding positions, but not aggressively increasing them.
The 30-day open interest Z-Score currently sits at 0.50, indicating that OI is just slightly above its 30-day average—well within normal volatility bands. Unlike previous corrections, where open interest surged during heavy selling, the current reading suggests neither extreme leverage buildup nor panic-driven position closures.
This unusual combination—weakening momentum paired with stable open interest—underscores a market in transition. Whether Ethereum resumes its downtrend or begins carving out a recovery will depend on how quickly momentum returns to spot and futures markets in the days ahead.
Open Interest Stability Signals a Market in Repositioning
According to the Arab Chain report on CryptoQuant, Ethereum’s $6.61 billion in open interest highlights that traders are still holding a substantial share of their positions despite the sharp decline from $3,900 to below $3,200. This divergence—falling price but steady OI—is characteristic of market repositioning phases, where traders reduce activity without fully exiting the market.
The supporting metrics reinforce this view: the OI avg30 sits at $6.44 billion, and the OI std30 at $329 million, indicating that current fluctuations remain well within normal volatility ranges. There is no sign of aggressive position buildup or liquidation pressure.

With the Z-Score at 0.50, the modest rise in open interest does not suggest overwhelming bearish leverage. Instead, it shows that traders are still engaging with the market and selectively building new positions as price declines. This level of participation is important: it signals that the derivatives market is active but not overheated.
Ethereum’s price weakness, driven by fading momentum after failing to sustain its previous highs, leaves the market at an inflection point. If large traders are predominantly short, stable OI could support the continuation of downward pressure. However, if long positions dominate, this same stability may lay the groundwork for a rebound once momentum returns.
Testing Momentum as Bulls Attempt to Reclaim Control
Ethereum is attempting to stabilize above the $3,150–$3,160 zone after a volatile multi-week decline. The chart shows ETH rebounding from a local low near $2,750, forming a short-term rising structure. However, momentum remains fragile. The 50-day SMA continues to slope downward and sits well above current price action, reinforcing the broader downtrend. Until ETH can break and close above this moving average, upside attempts will likely face resistance.
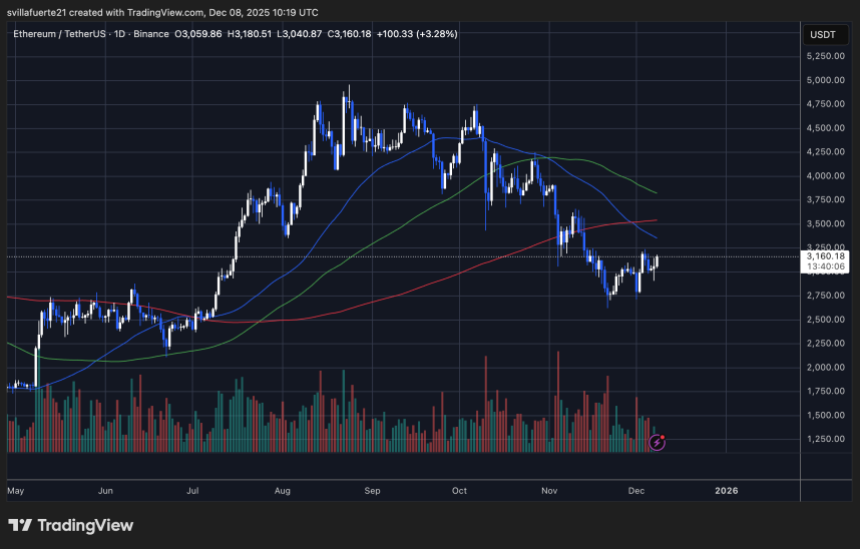
The 100-day SMA is also declining, converging with the $3,350–$3,400 region—an area that could act as the next major ceiling for any bullish continuation. Meanwhile, the 200-day SMA remains flat but sits just above price, creating an additional barrier around $3,250–$3,300. This cluster of resistance levels confirms that Ethereum is still operating within a corrective structure despite the recent bounce.
Volume has tapered off noticeably compared to the heavy sell-side spikes seen in November. This suggests that the rebound may be driven more by diminishing selling pressure than strong spot demand. If volume remains weak, ETH may struggle to build enough momentum for a sustained recovery.
Featured image from ChatGPT, chart from TradingView.com


You May Also Like

Former Ripple CTO Reveals XRP’s Origins with Bitcoin & PayPal Input

Trump's security pick ousted by his own party after contract tampering


