

Disclamer: the material is not a financial recommendation or a call to action. The analysis presented is the private opinion of its author. Incrypted is not responsible for the investment decisions of readers.
Disclamer: the material is not a financial recommendation or a call to action. The analysis presented is the private opinion of its author. Incrypted is not responsible for the investment decisions of readers. Last week, the market showed signs of recovery, with bitcoin trying to gain a foothold above $90,000. The price started to rise, […] Сообщение Awaiting the Fed’s Decision: Trader Analyzes Bitcoin Price Movement Scenarios появились сначала на INCRYPTED.Disclamer: the material is not a financial recommendation or a call to action. The analysis presented is the private opinion of its author. Incrypted is not responsible for the investment decisions of readers. Last week, the market showed signs of recovery, with bitcoin trying to gain a foothold above $90,000. The price started to rise, […] Сообщение Awaiting the Fed’s Decision: Trader Analyzes Bitcoin Price Movement Scenarios появились сначала на INCRYPTED.
Awaiting the Fed’s Decision: Trader Analyzes Bitcoin Price Movement Scenarios
For feedback or concerns regarding this content, please contact us at [email protected]
- Last week the market partially recovered.
- This week, the main factor is the Fed’s decision.
- Further movement of high-risk assets, including cryptocurrency, will depend on the regulator and the dollar’s reaction.
Last week, the market showed signs of recovery, with bitcoin trying to gain a foothold above $90,000. The price started to rise, but on December 4, 2025, on the background of macro data, the market weakened: the gap zone (FVG) on the four-hour chart was finished, some of the long positions were knocked out by stops, and the week closed more in a “respite” mode than a continuation of the rally.
That’s why I didn’t take a long before opening the new week, there aren’t enough clear patterns for that.
Right now the market is back in the “waiting room” mode. There is some movement, but the key outcome will depend on the outcome of the US Federal Reserve (Fed) meeting on Wednesday, December 10, 2025.
The market estimates the probability of a 25 basis point rate cut at around 90%. But much more important are the comments of Fed Chairman Jerome Powell and his hints on the regulator’s future course. His term of office is coming to an end, and early next year we may see a new figure at the head of the Fed — and with it a different rhetoric.
Against this backdrop, there are three main bitcoin scenarios.
Scenario A — Liquidity Pickup From the Top and Rebound
There remains a shelf of liquidity from above and 4H FVG, which the market never picked up last week. You can see from the clusters — there are a lot of stop orders above the recent highs, but last time buyers failed to push the price to this zone.
Basic bullish option: pull the price to the upper shelf, take stops above the highs, close FVG and from there form a pullback with the possibility of picking up a long on reaction.
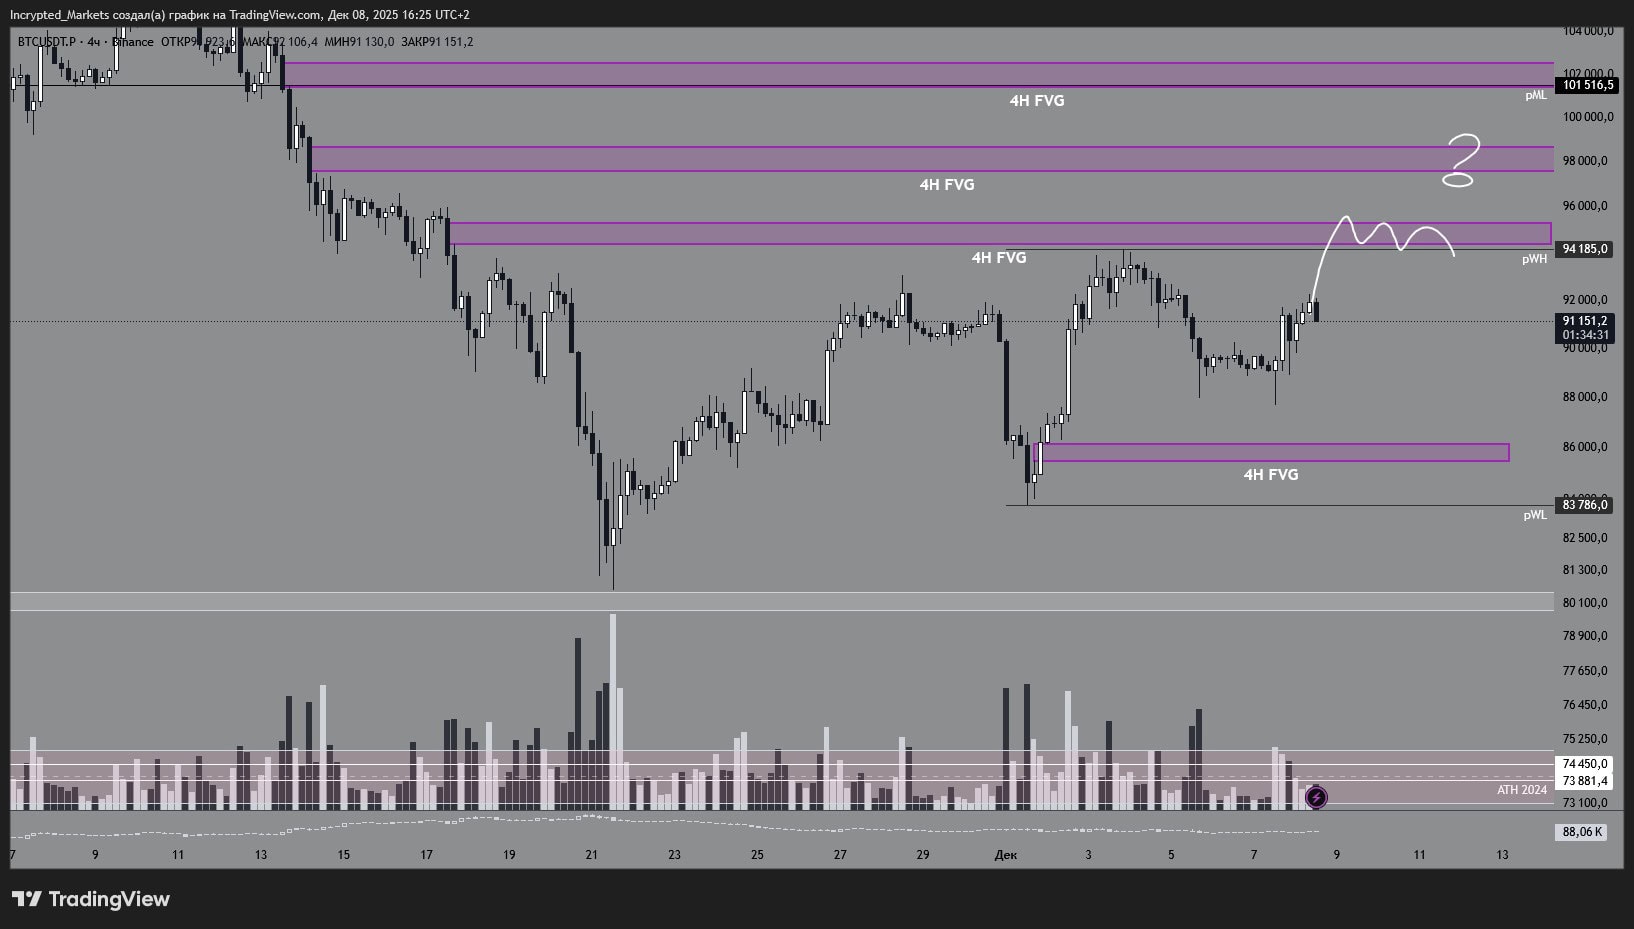 Four-hour chart of BTC/USDT.P. Data: TradingView.
Scenario B — “Saw” in the $87,000-$93,000 Range With Deviations in Both Directions
This range looks like a comfortable zone for accumulation ahead of a rate decision. Up/down moves with a quick return inside the range will allow large participants to reshuffle positions and build liquidity for the next impulse after the Fed.
This scenario reads as “waiting for Wednesday”: inside the corridor we work carefully from the boundaries and clear reactions, not trying to catch every candle and not accelerating the shoulders.
 Four-hour chart of BTC/USDT.P. Data: TradingView.
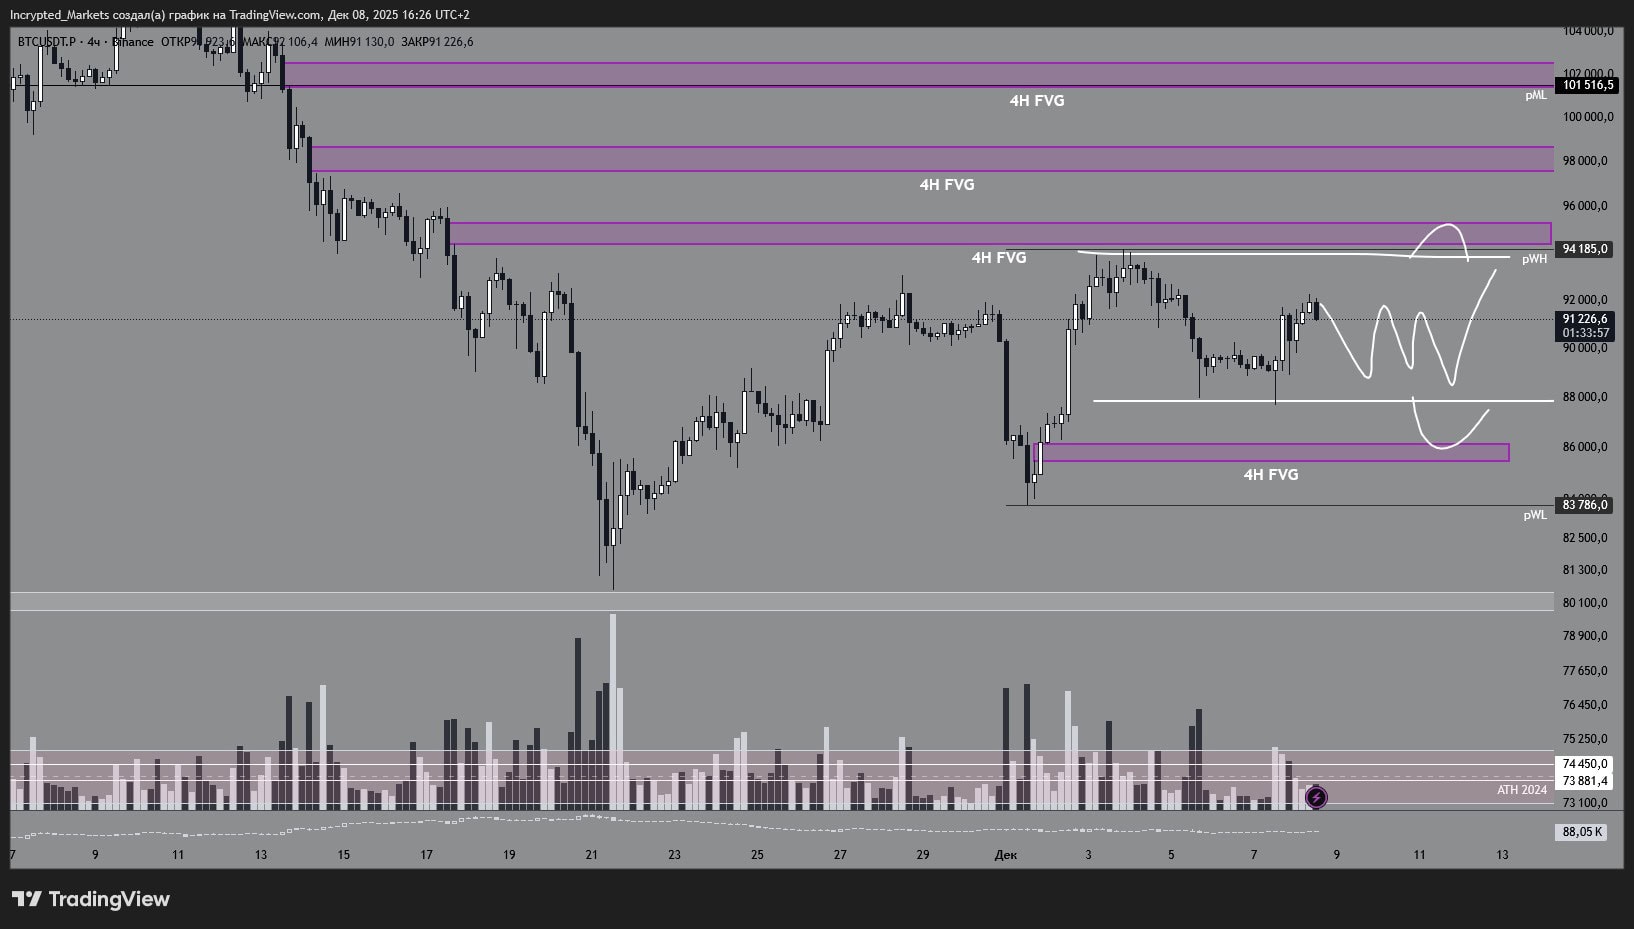
Scenario C — Liquidity Sweep From Below
A characteristic liquidity shelf of equal lows remains at 4H. This is a classic target for stopes: the market may first take out these lows, gather liquidity under the range, and then form a reversal pattern.
We do not rule out that scenario C can be combined with A: first, the market may take out stops from above, then aggressively dump and mop up the lows, and then look for longing setups in reaction to the lower levels.
 Four-hour chart of BTC/USDT.P. Data: TradingView.
Bottom Line
The main magnet of this week is the Fed meeting and Powell’s comments. But, as always, the news background remains in the background, we make decisions not by headlines, but by liquidity, price structure and the presence of “own” situations in the system.
The week promises to be interesting, but at the same time not easy. We work with volatility, do not get involved in every movement, observe the risk and stick to those sets in which we understand what we are doing and why.
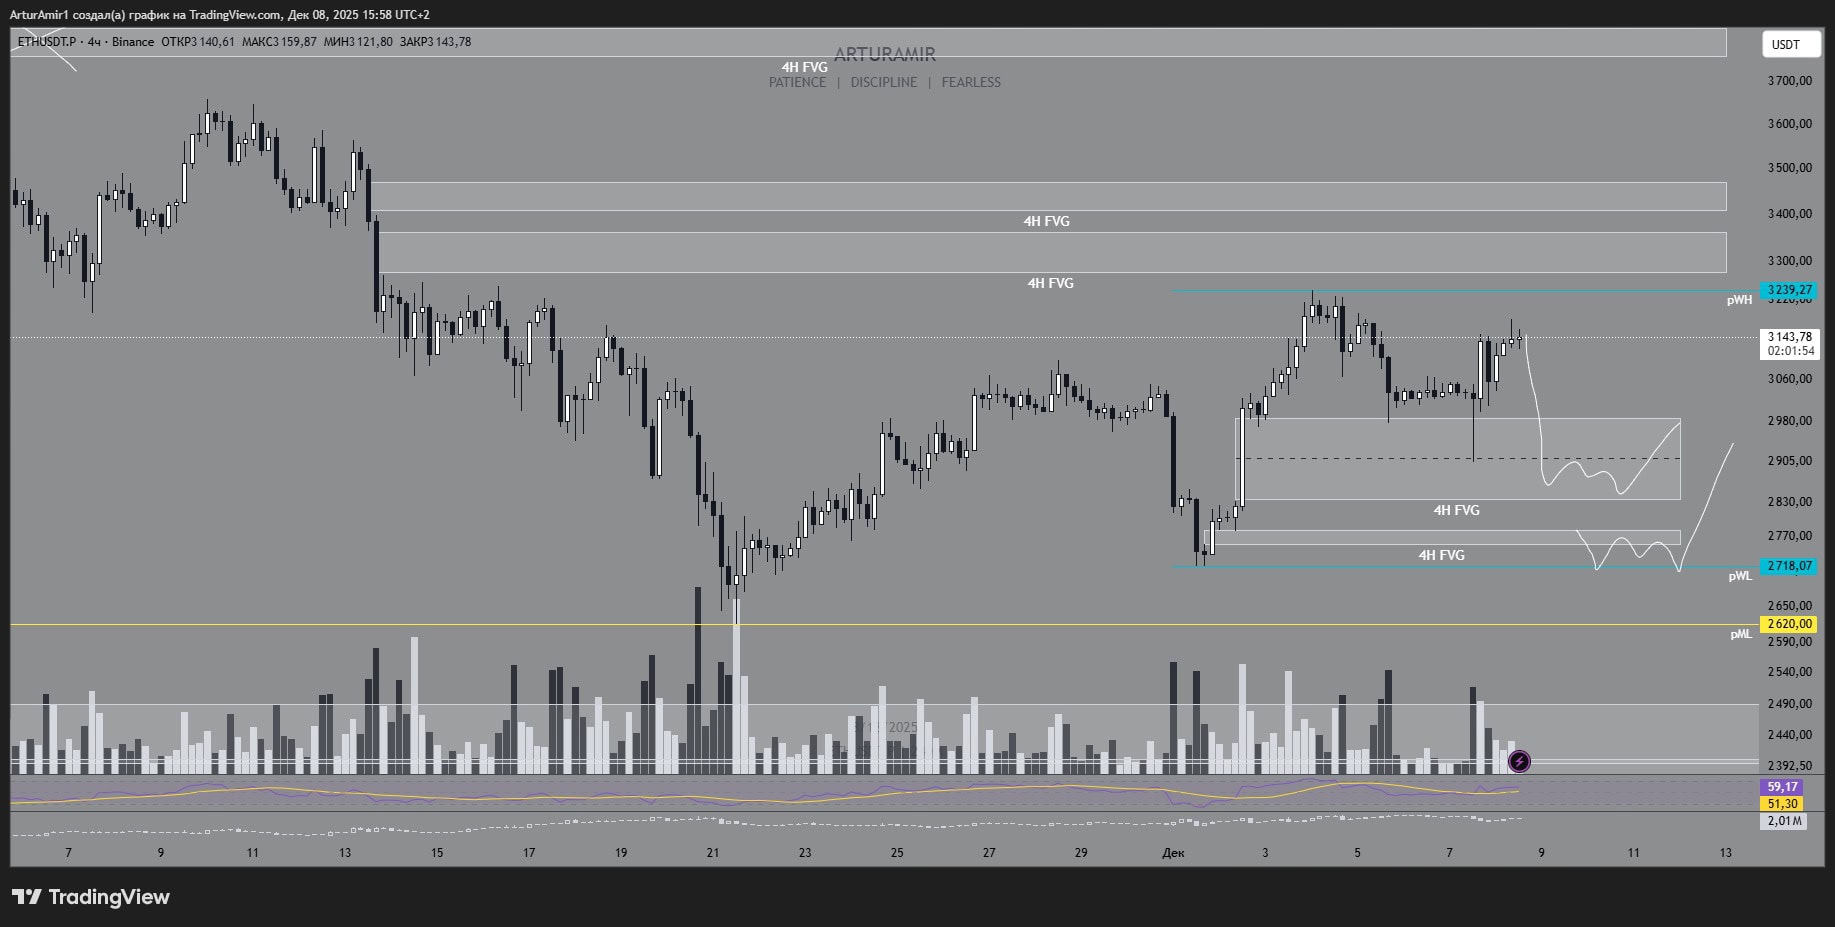
Like bitcoin, the asset marked an upward movement. At the time of writing, it is trading around $3140. The price approached the level where there is strong resistance (pWH) and previously actively sold — $3230-$3250. From below, there are unfilled zones (4H FVG) and the base of the last impulse — that is where the price will be pulled if the market wants to “cool heads” before the Fed meeting.
Key benchmarks
- pWL $2718 — the lower boundary of the current range, the base of the last growth;
- pML $2620 — support below, boundary of deeper correction;
- 4H FVG $2980-$2860 — upper liquidity pocket below price;
- 4H FVG $2780-$2720 — lower pocket just above pWL;
- pWH $3230-$3250 — nearest strong resistance;
- Higher on the map are the $3300-$3400 and $3450-$3550 zones (4H FVG and the senior TF supply area).
Here we will also consider three basic scenarios.
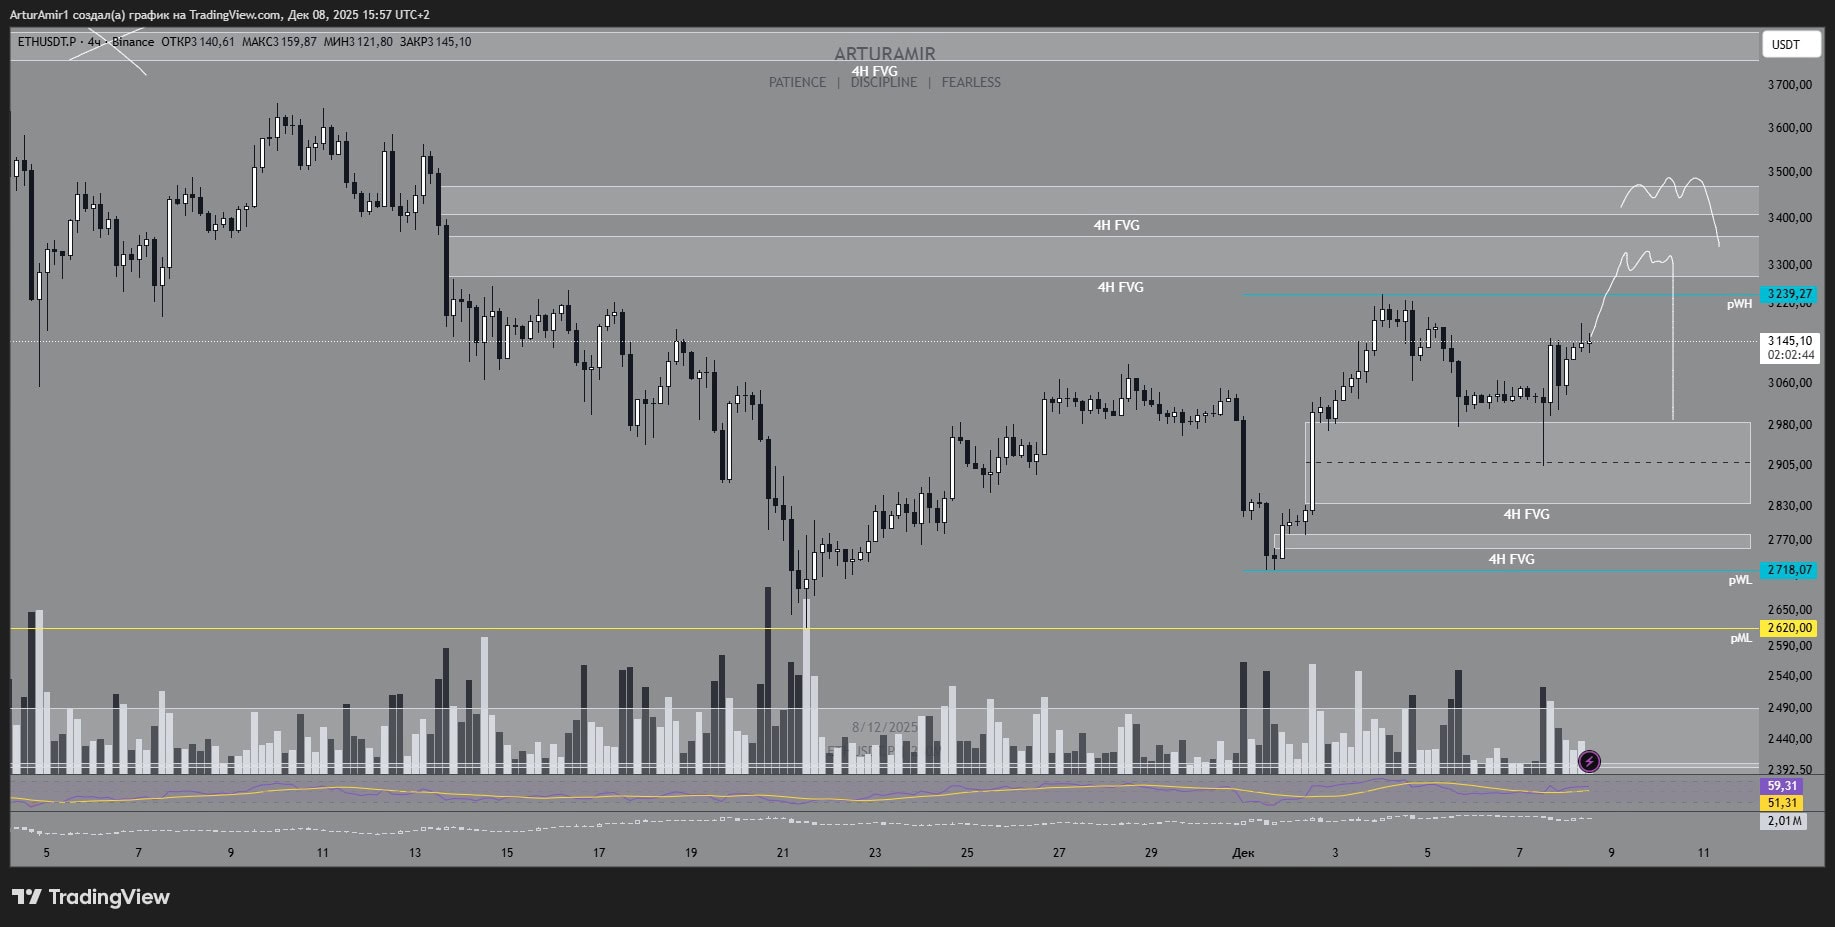
Scenario A — Correction in the FVG and Search for Longs
The idea here is as follows — the current growth is exhausted, Ethereum is taken to one of the FVGs at the bottom, a base is formed there, and they try to lead the price back to pWH and higher.
In this regard, we would like to see the demolition of local longs and going to $2980-$2860 without an aggressive volume seller. Or get to the $2780-$2720/pWL $2718 area with an obvious buyback and tails down.
From there we can look for a neat long by the system: entry from the demand zone, stop behind the structure minimum, first targets — return to $3050-$3100, then test $3230-$3250. Invalidation — clean break and hold below $2718.
 Four-hour chart of ETH/USDT.P. Data: TradingView.
Scenario B — Takeout to pWH and Hard Pullback
The key idea is “collect stops and throw out of the market”. First push the price into the $3230-$3250 area, take liquidity above the highs, then reverse the move down.
Signs of realization:
- exit into pWH on higher volumes with a clear seller reaction;
- quick return under $3100, with no consolidation above pWH;
- failure through upper FVG $2980-$2860 with almost no bounce.
Targets: test $2780-$2720/pWL $2718, if pressure intensifies — possible breakout towards pML $2620 for the sake of removing stops under support.
Invalidation: sustained H4 consolidation above $3250.
 Four-hour chart of ETH/USDT.P. Data: TradingView.
Scenario C — Breakdown of pWH and Work With Upper Zones
A more bullish scenario: the market does not go into a deep correction, but breaks pWH and proceeds to take liquidity in the upper FVGs.
What this could look like:
- H4 consolidation above $3230-$3250 without a quick pullback;
- movement to $3300-$3400, then $3450-$3550 with volume growth.
Formation of another base or distribution there — on reaction we decide whether to hold medium-term long or look for a reversal.
Tactics: work on the trend from pullbacks after the breakdown of pWH; potential shorts — only with clear distribution signals and synchronous reversal of bitcoin.
 Four-hour chart ETH/USDT.P. Data: TradingView.
Bottom Line
The general logic with working on Ethereum is as follows:
- work from the zones, not from the middle of the move: $2980-$2860, $2780-$2720, $2718, $3230-$3250, $3300-$3400, $3450-$3550;
- looking at bitcoin bundle: realization of bearish scenarios on bitcoin reinforces option B on ETH; holding the $87,000-$93,000 range and bitcoin bounce will support A/C.
- week with the Fed, so we leave the risk on the idea moderate, keep the leverage low and wait for our setups rather than trading every fluctuation.
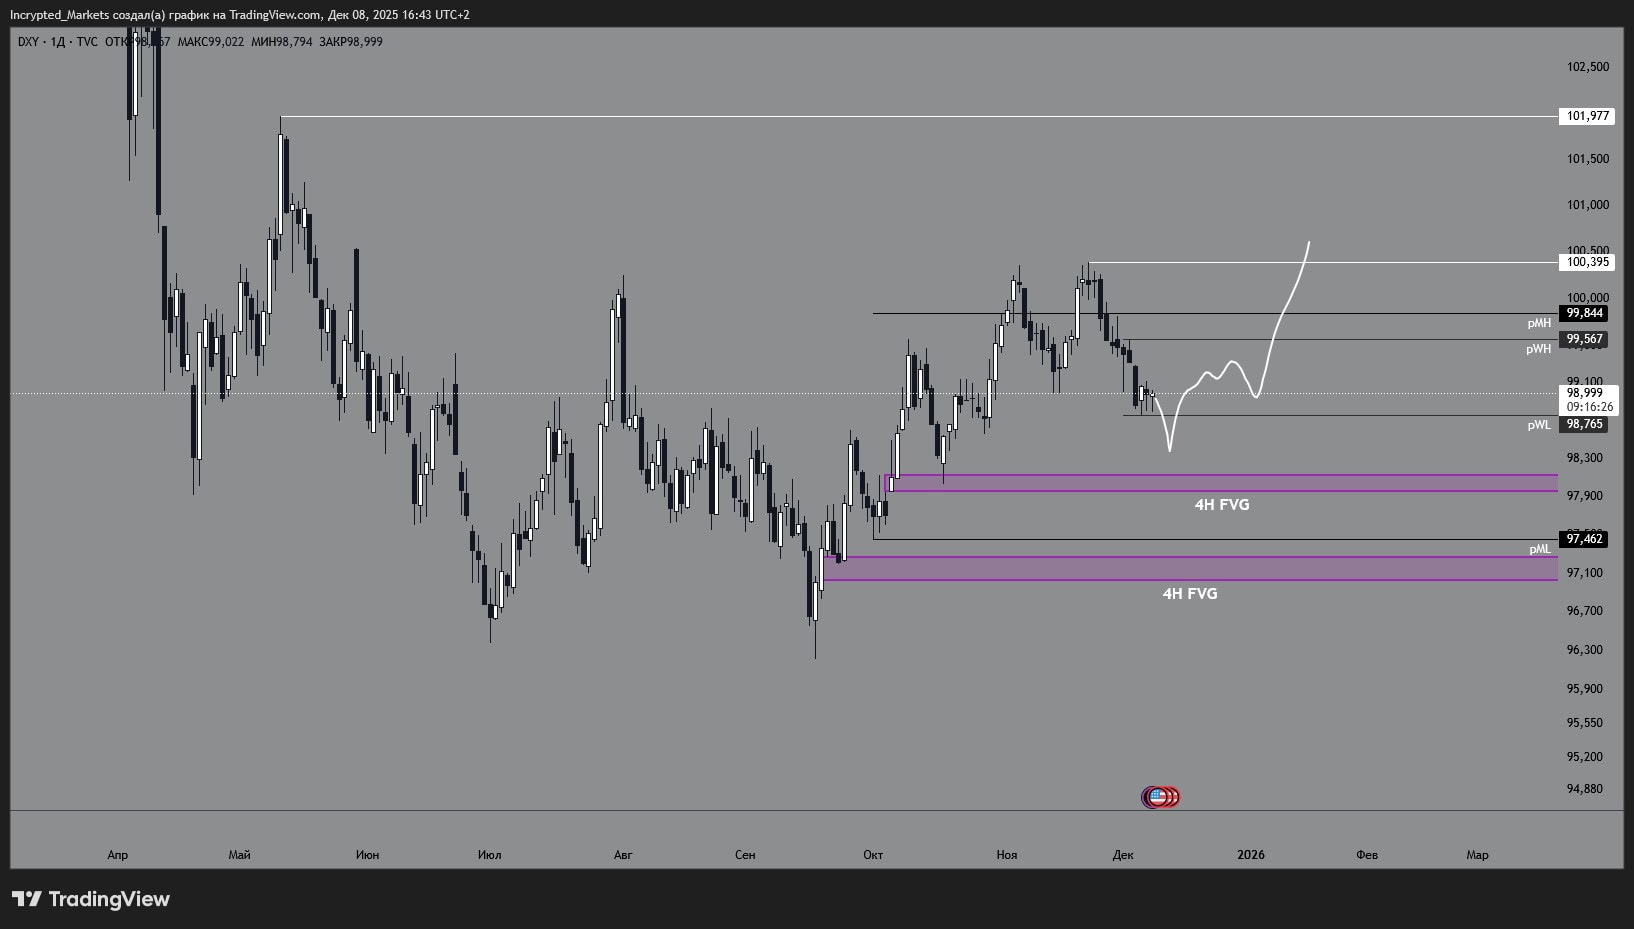
The dollar index has been hovering around the 99-point mark for several sessions now, which is the area of local support and five-week lows. The market has all but priced in a Fed rate cut this week and is gently pushing the dollar down, which is supporting gold, the euro and risk assets, according to Reuters.
Important to note here:
- rising DXY = pressure on equities and crypto assets;
- weakening dollar = easing for high-risk assets and generally support for bitcoin and Ethereum.
Below are the base case scenarios for index movement for the coming week.
Scenario A — Defense of Support and Upward Bounce
Idea: the area of current lows holds, the market uses the Fed meeting as an excuse for a technical bounce in the dollar.
Signs of formation:
- holding the area of recent lows without a confident breakout;
- softer-than-expected Fed reaction: either less emphasis on future rate cuts or more cautious rhetoric from Powell;
- rising US Treasury bond yields after the data release.
Then the index may go into an upward correction — with the aim of testing the upper boundary of the range of the last weeks and partially “squeeze” the excessive shorts in the dollar out of the market. For the crypto market, this is a scenario of a moderate headwind: a sharp collapse is not necessary, but the rally will be hard to continue against the backdrop of a strengthening DXY.
 DXY daily chart. Data: TradingView.
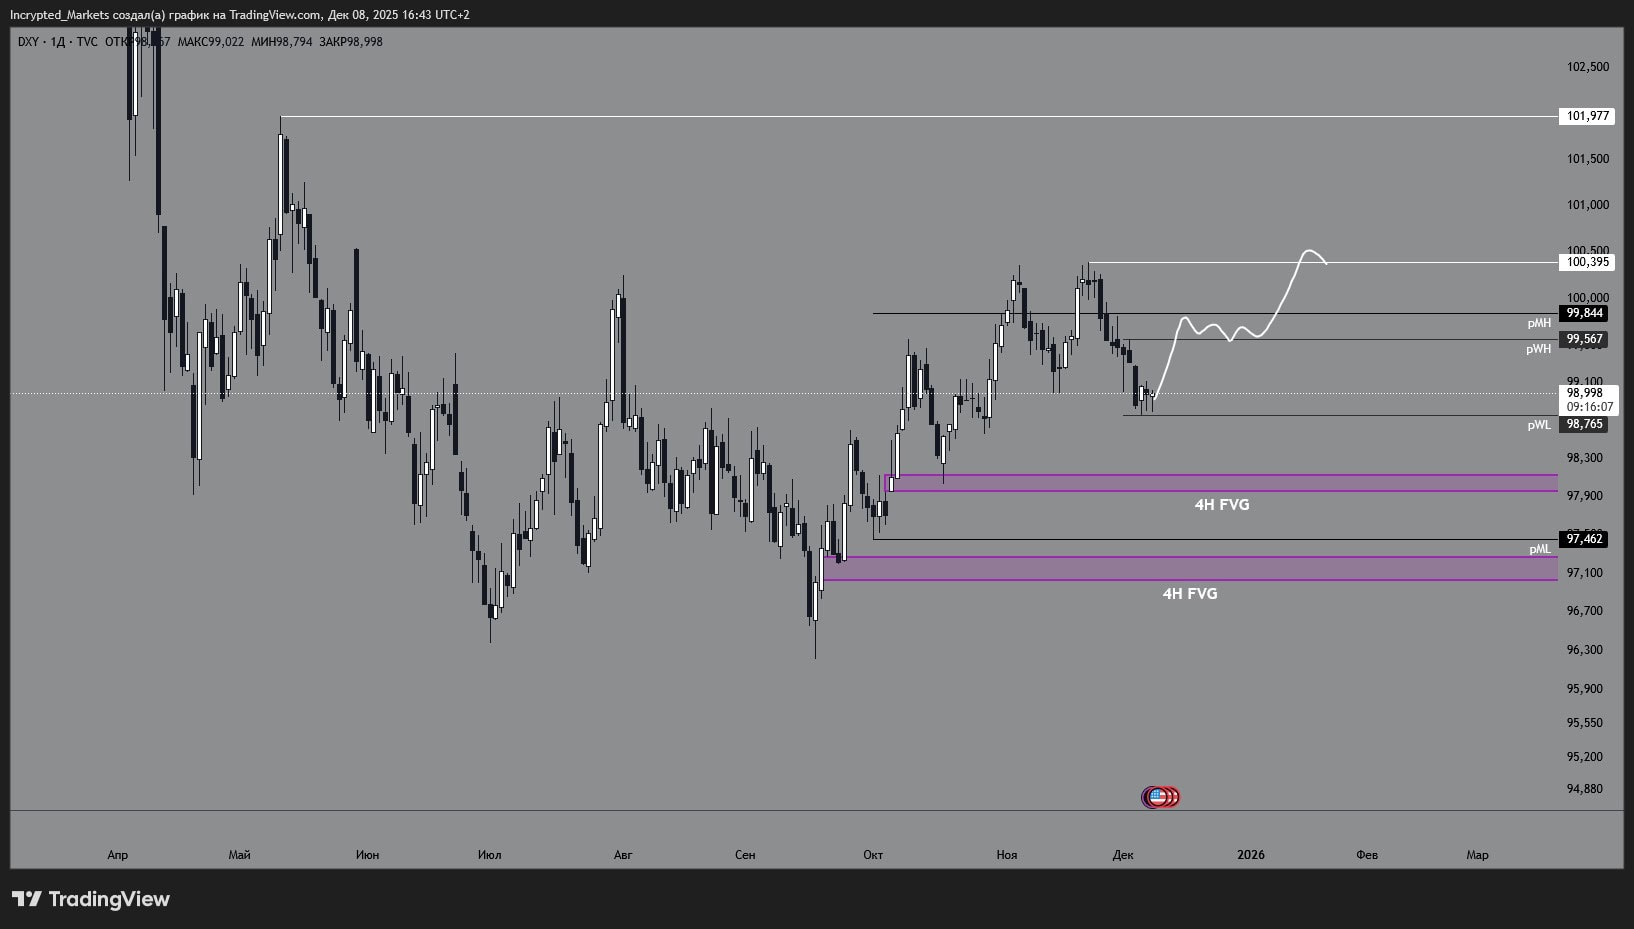
Scenario B — Sideways 98.5-100 and “Wait-and-See” Mode
A more neutral scenario: the Fed does exactly what the futures are expecting, with no surprises, and the new inflation/labor market data does not knock the market out of its rut. In this case, DXY continues to “saw” in a narrow range around 99, with frequent false upside and downside pullbacks.
Signs of realization:
- lack of impulse on the fact of the Fed decision, quick return to the corridor after the first reaction;
- candlestick structure with long tails and small bodies on the daily/4H;
- neutral dynamics on the main pairs EURUSD/GBPUSD/USDJPY.
For us, this scenario means that the currency background does not prevent cryptoassets from trading in their own sets: there is neither strong support nor strong pressure from the dollar, the market is living local stories and ETF flows.
 DXY daily chart. Data: TradingView.
Scenario C — Support Breakdown and Acceleration of the Decline
A bearish scenario for the dollar and the most “pleasant” for high-risk assets. Here DXY does not hold the current support, goes below the important 98.5-98.6 zone and consolidates under it. Such a move is possible if:
- the Fed not only cuts the rate, but clearly indicates a willingness for further easing;
- new data on inflation and consumer price index confirm the slowdown in the economy;
- the market reinforces expectations of a series of rate cuts in 2026, according to Reuters.
In this case, a road to deeper support levels opens up on the index, and the antagonist currencies (euro, pound, yen) get room to grow. For crypto assets, such a set-up usually means strengthening of the risk-on regime: against the background of a soft dollar, bullish scenarios for bitcoin, Ethereum and altcoins are easier to realize.
 DXY daily chart. Data: TradingView.
Bottom Line
In this context, it is important to keep in mind:
- follow the DXY reaction to the Fed’s support and rhetoric: it is a background indicator that sets the tone for the entire risk-block;
- we do not try to guess the exact path — we work with already formed scenarios and reaction to key levels on the charts above;
- for crypto assets it is not the level of the index itself that matters, but the direction: a stable dollar puts pressure on them, a weakening dollar creates a window of opportunity for continued growth.
You can watch the full version of this market analysis issue on Incrypted’s YouTube channel.
As a reminder, we have launched a new channel in Telegram — Incrypted Markets. In it you will find the most up-to-date market analysis, forecasts and opinions on further price movements.
We also note that trading is a separate and important direction in the Incrypted Plus community. This is a closed community, whose members are the first to receive various exclusive materials — guides, analysis and so on. For details on how to join this community, please follow this link.
Market Opportunity
Notcoin Price(NOT)
$0.0003756
$0.0003756$0.0003756
USD
Notcoin (NOT) Live Price Chart


Disclaimer: The articles reposted on this site are sourced from public platforms and are provided for informational purposes only. They do not necessarily reflect the views of MEXC. All rights remain with the original authors. If you believe any content infringes on third-party rights, please contact [email protected] for removal. MEXC makes no guarantees regarding the accuracy, completeness, or timeliness of the content and is not responsible for any actions taken based on the information provided. The content does not constitute financial, legal, or other professional advice, nor should it be considered a recommendation or endorsement by MEXC.
You May Also Like

The changing face of elder care in Malaysia — Sayed Mohammad Reza Yamani Sayed Umar
JULY 10 — An elderly society is becoming increasingly prevalent in Malaysia at present. It is projected that the p...
Share
Malaymail2026/07/10 15:24

Not a loophole: Singapore AI export controls let China tap US AI legally
American AI technology is reaching Chinese tech giants through a route that US export controls were never designed to close: Singapore. The city-state sits outside
Share
The Cryptonomist2026/07/10 14:46

Iran’s army chief warns of ‘total destruction’ for ground invasion
The post Iran’s army chief warns of ‘total destruction’ for ground invasion appeared on BitcoinEthereumNews.com. Iran’s army chief warned of “total destruction”
Share
BitcoinEthereumNews2026/04/02 18:15


