Solana’s (SOL) price action has entered a critical phase as the asset continues to defend the $131 support zone, one of the most important technical levels on its mid-term chart.Solana’s (SOL) price action has entered a critical phase as the asset continues to defend the $131 support zone, one of the most important technical levels on its mid-term chart.

Solana price shows signs of accumulation at $131, reversal in sight?

2025/12/10 03:08

Solana price is holding firm at the key $131 support level, with early signs of accumulation suggesting a potential trend reversal.

Summary
  • Investor sentiment is gradually improving as Solana shows resilience despite broader market weakness.
  • Consolidation duration increases the probability of a meaningful recovery move.
  • A shift in volume behaviour will be the main catalyst determining Solana’s next major direction.

Solana’s (SOL) price action has entered a critical phase as the asset continues to defend the $131 support zone, one of the most critical technical levels on its mid-term chart. After weeks of persistent downside pressure, Solana is now exhibiting characteristics often associated with early accumulation, a process that can precede a bullish reversal if sustained.

Solana price key technical points

  • $131 support has held for nearly a month, signalling strong underlying demand.
  • Accumulation structure forming, with repeated defenses of the swing low.
  • Upside targets include $187, aligning with value area low and high-time-frame resistance.
Solana price shows signs of accumulation at $131, reversal in sight? - 1

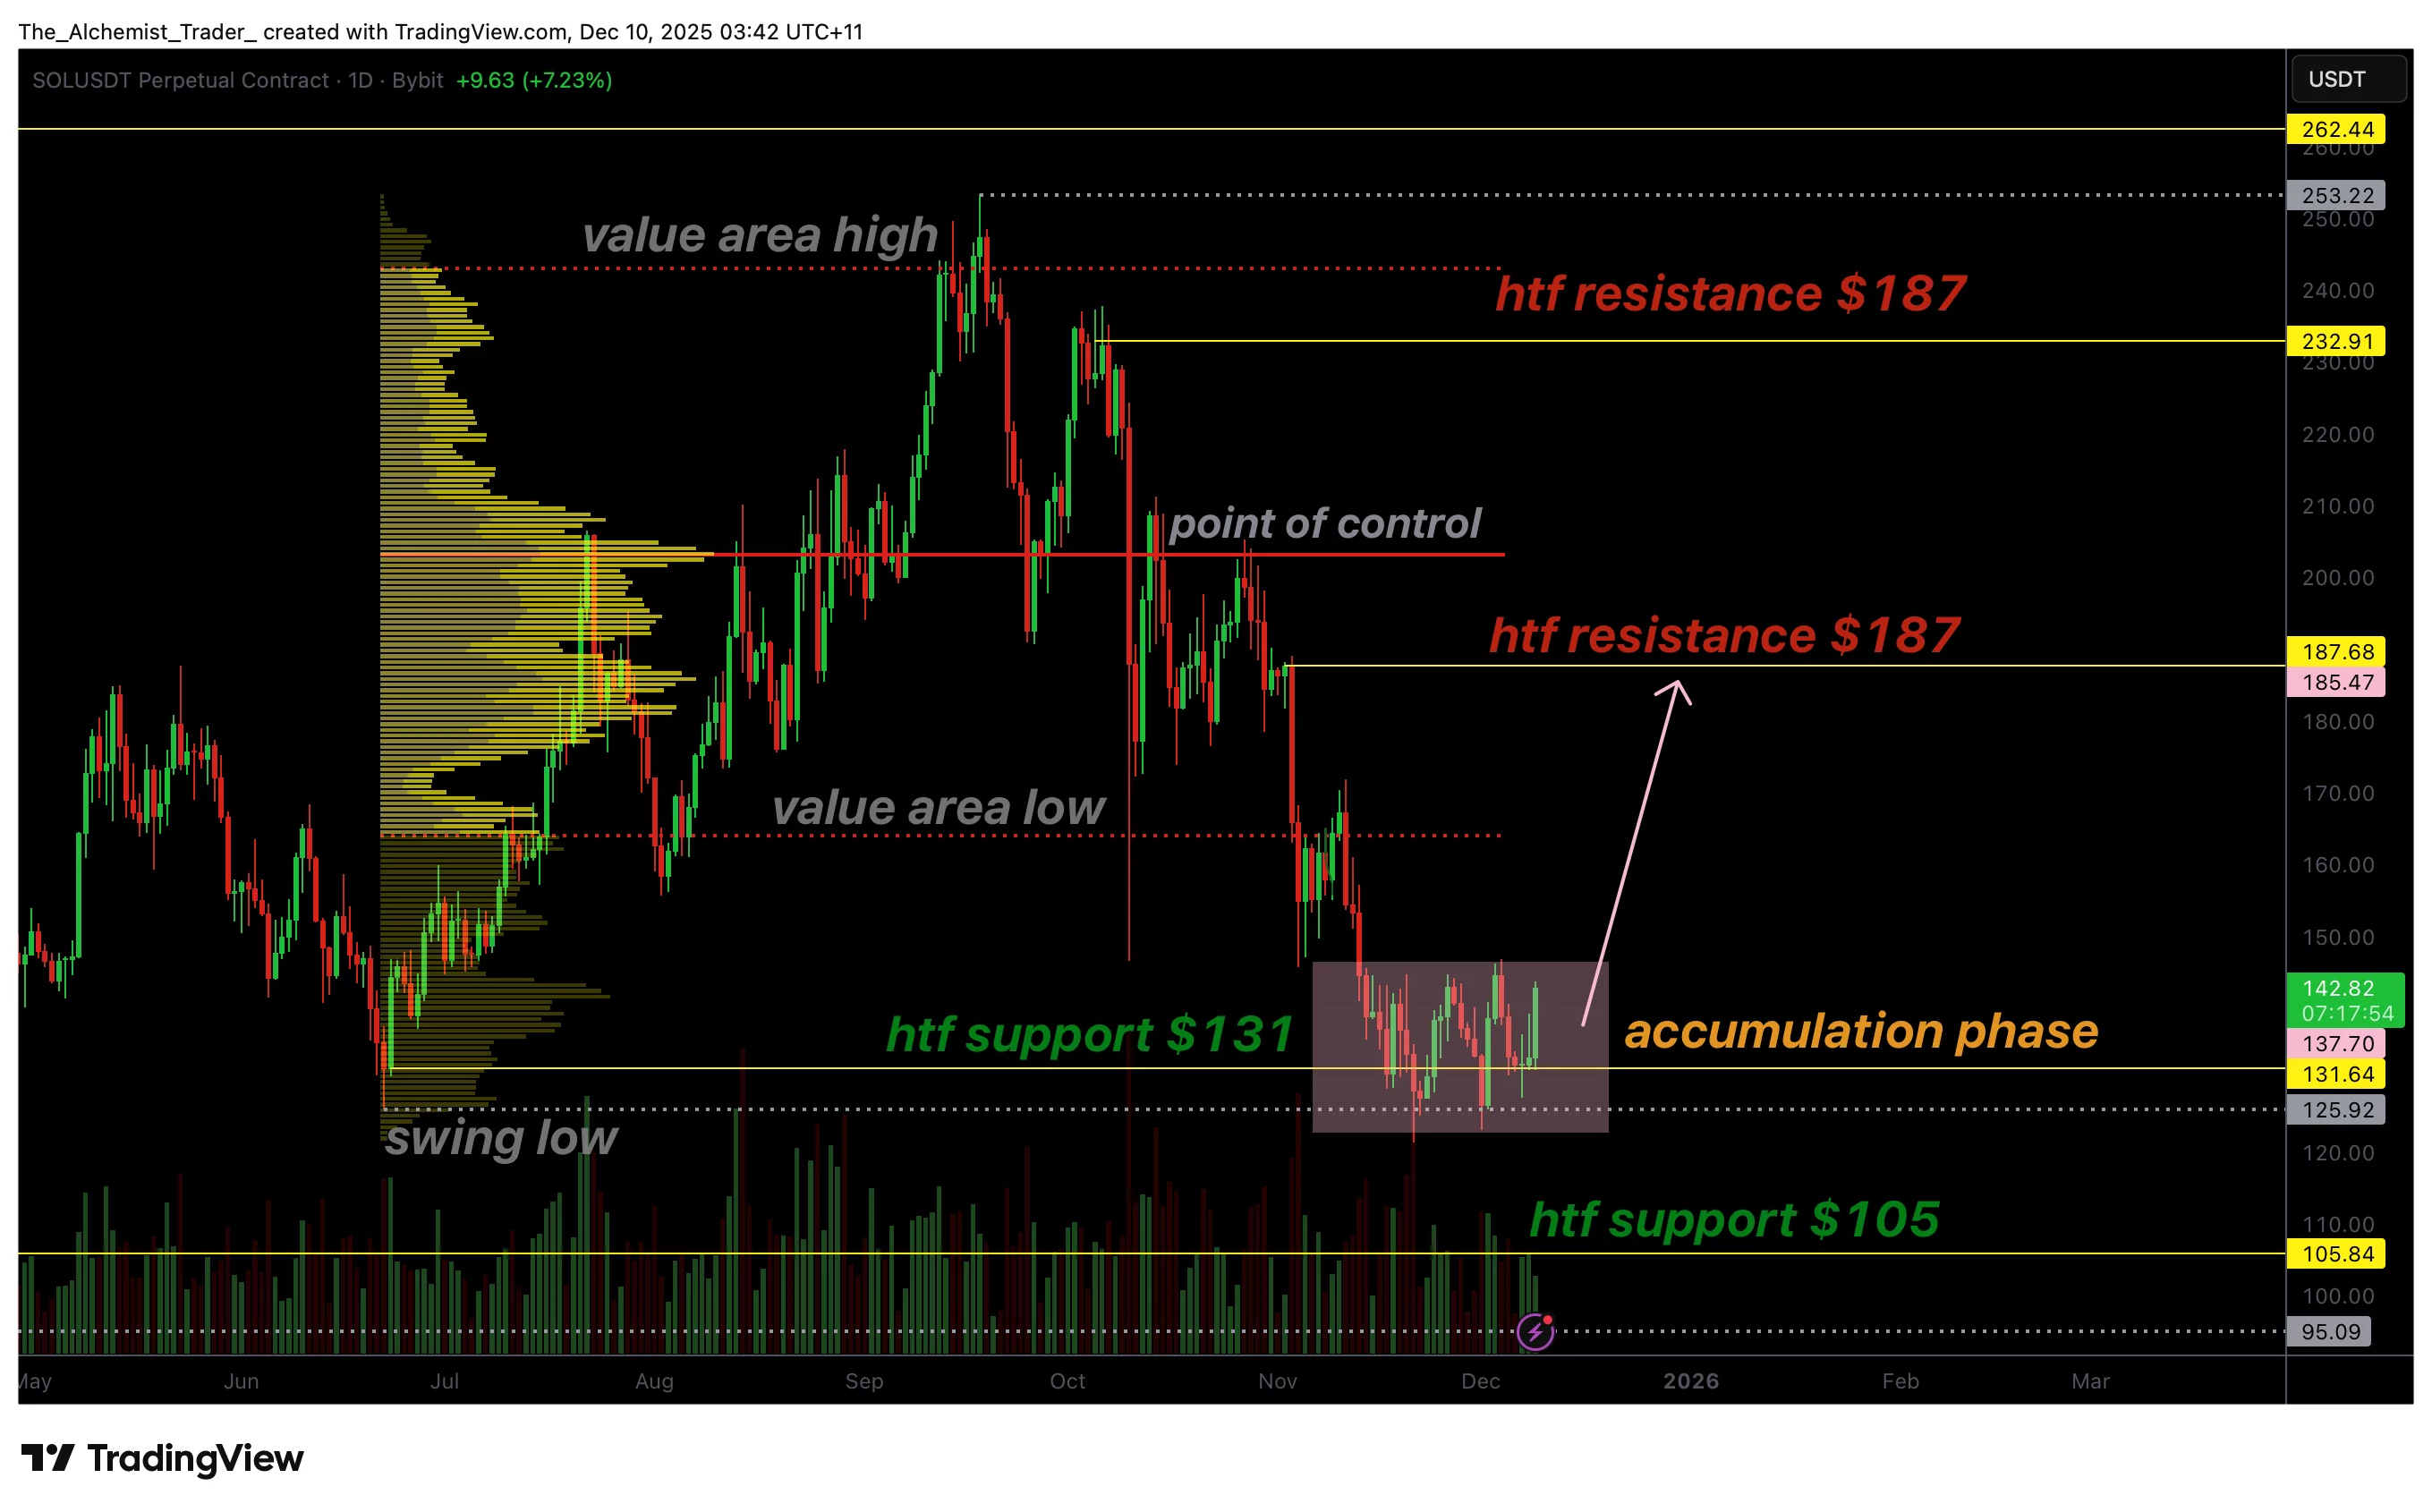
Solana’s prolonged defense of the $131 support has become one of the defining technical signals of its current consolidation phase. Over the past month, the price has repeatedly tested this level without breaking below it, suggesting that buyers are absorbing selling pressure efficiently. This behavior often occurs within accumulation zones, where participants gradually build positions before a broader market expansion.

The current consolidation mirrors classic accumulation formations, in which price compresses within a range as the market transitions from distribution to absorption. Solana’s failure to break below its recent swing low reinforces the idea that the market has found a temporary floor.

Each test of the support level has been met with visible demand, further strengthening the case for this region acting as a structural pivot. And with cross-chain activity expanding—most recently through Base and Solana enabling asset transfers via a new bridge secured by Chainlink and Coinbase—broader ecosystem growth may help support sentiment during this accumulation phase.

As long as Solana continues to close candles above $131, the accumulation thesis remains intact. Maintaining this level allows market structure to stabilize and increases the probability of a bullish rotation. Should the consolidation continue tightening without breaking down, Solana may be setting the foundation for a reversal toward higher resistance zones.

On the upside, the first major target remains the value area low, followed by the $187 high-time-frame resistance level, a region that historically acts as a major decision point for Solana’s trend. A breakout from the accumulation range with supporting volume would significantly increase the likelihood of price revisiting this resistance.

It is important to acknowledge that accumulation phases often require time to mature. Solana has already spent several weeks trading around this support, which is typically sufficient to identify the early stages of a re-accumulation range. This duration suggests that a structural shift could be underway, but confirmation will depend on volume expansion and a break above local resistance levels.

From a broader perspective, Solana’s current location on the chart represents the lower boundary of its value distribution. Historically, such areas often mark optimal reversal zones, especially when previous tests have produced substantial bullish expansions. Should this scenario repeat, Solana could be preparing for another strong move to the upside.

What to expect in the coming price action

If Solana successfully maintains support at $131 and continues forming higher lows, the likelihood of a bullish reversal strengthens. A breakout from the current accumulation range may trigger a rally toward $187. However, a breakdown below the support would invalidate the structure and open the door for deeper corrective moves.

Disclaimer: The articles reposted on this site are sourced from public platforms and are provided for informational purposes only. They do not necessarily reflect the views of MEXC. All rights remain with the original authors. If you believe any content infringes on third-party rights, please contact [email protected] for removal. MEXC makes no guarantees regarding the accuracy, completeness, or timeliness of the content and is not responsible for any actions taken based on the information provided. The content does not constitute financial, legal, or other professional advice, nor should it be considered a recommendation or endorsement by MEXC.

You May Also Like

‘Already seen the low?’ – Inside Cathie Wood’s bet on a new Bitcoin cycle

‘Already seen the low?’ – Inside Cathie Wood’s bet on a new Bitcoin cycle

The post ‘Already seen the low?’ – Inside Cathie Wood’s bet on a new Bitcoin cycle appeared on BitcoinEthereumNews.com. Bitcoin has rarely looked more fragile, and many analysts are already referring to this as the worst fourth quarter on record, marked by a massive leverage wipeout and a steep drop from its all-time highs. For over a decade, Bitcoin [BTC] has followed a harsh, predictable pattern: a Halving event, a commendable rally to new highs, and then a brutal 75–90% crash that resets the entire market. This cycle shaped the crypto world and created the “crypto winter” mentality that traders have come to expect. Cathie Wood challenges the four-year cycle But according to Cathie Wood, CEO and CIO of ARK Invest, those old rules no longer apply. Speaking with Fox Business, Wood made a profound declaration: institutional adoption is actively “disrupting” the traditional Bitcoin cycle. Wood noted that growing participation in U.S. Spot Bitcoin ETFs had started to change how BTC absorbed volatility. She pointed to a steady decline in its two-year volatility trend over the past five years, adding fuel to the idea of a maturing asset. Why Bitcoin’s old pattern may be fading Wood’s view challenges over a decade of beliefs built around Bitcoin’s strict, predictable four-year cycle. The evidence for this cycle is compelling.  For instance, the 2012 Halving saw Bitcoin surge from under $10 to a peak of roughly $1,100; the 2016 Halving fueled a climb from $400 to nearly $20,000; and the 2020 Halving propelled the asset from $8,500 to a record high of around $69,000. Each of these explosive rallies was followed by a painful, defining drawdown of 70% to 85%, resetting the stage for the next run. This predictable pattern, last triggered by the 20th April 2024, Halving, has historically been the sole script for investors. Yet, this time, the narrative feels disjointed and disruptive. What is Wood so concerned about? Wood…
Share
BitcoinEthereumNews2025/12/11 19:15
The Critical Security Play You Can’t Miss in the AI Era

The Critical Security Play You Can’t Miss in the AI Era

The post The Critical Security Play You Can’t Miss in the AI Era appeared on BitcoinEthereumNews.com. The Watershed Moment That Changed Blockchain Security Forever Singapore – Blockman PR – December 2025 marked a turning point. Anthropic’s research team published findings that sent shockwaves through crypto: AI systems could successfully exploit smart contract vulnerabilities with 55.88% accuracy, simulating $4.6 million in potential theft from real-world contracts. The implications were existential. If AI could systematically identify and exploit vulnerabilities at scale, the entire blockchain ecosystem—processing over $1 trillion in transactions annually—faced an unprecedented threat. Traditional security tools couldn’t keep pace. Human auditors, already stretched thin reviewing less than 20% of deployed contracts, had no chance against autonomous AI attackers. But here’s what most people missed: Anthropic’s breakthrough wasn’t just validation of the threat. It was validation of the solution space. And one company had already been building that solution for six months—and winning. The Defense Was Already Operational While Anthropic demonstrated AI could break smart contracts in simulation, AgentLISA had been defending them in production. By the time Anthropic’s paper dropped, AgentLISA’s multi-agent system had detected over $7.3 million in actual vulnerabilities across real protocols managing billions in assets. The asymmetry is critical: Anthropic proved the threat is real and AI-powered. AgentLISA proved the defense is real, AI-powered, and already operational at scale. This matters because Anthropic’s research exposed something fundamental: the AI security race will be won by whoever controls the training data. And AgentLISA just lapped the entire field. LISA-Bench: The Data Moat Nobody Saw Coming https://github.com/agentlisa/bench Anthropic’s team used SCONE-bench—a dataset of 413 vulnerable smart contracts—to train their attack models. Solid methodology, respectable work. But fundamentally constrained by data scarcity. AgentLISA’s response was devastating: LISA-Bench, containing 23,959 professionally verified vulnerability records spanning 2016-2024—the largest curated smart contract vulnerability dataset ever assembled. It’s not just 60 times larger than SCONE-bench. It includes 10,185 code-complete vulnerability cases…
Share
BitcoinEthereumNews2025/12/11 19:01