

Bitcoin Price Shows Fresh Strength—Could This Spark a Rapid Rally?
Bitcoin price started a decent increase above $92,000. BTC is now consolidating gains and might aim for another increase if it clears $93,400.
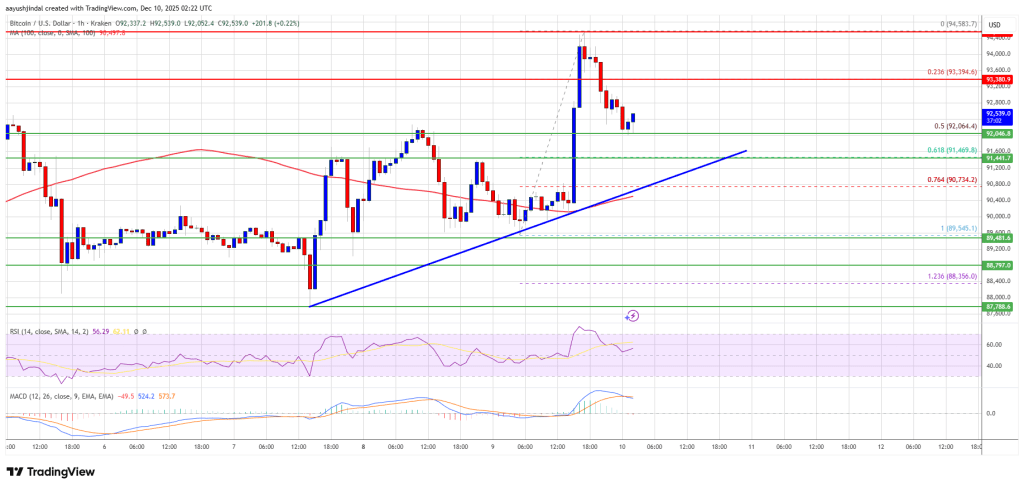
- Bitcoin started a downside correction from the $94,500 zone.
- The price is trading above $92,000 and the 100 hourly Simple moving average.
- There is a bullish trend line forming with support at $91,500 on the hourly chart of the BTC/USD pair (data feed from Kraken).
- The pair might continue to move up if it settles above the $93,400 zone.
Bitcoin Price Holds Support
Bitcoin price managed to stay above the $91,000 zone and started a fresh increase. BTC gained strength for a move above the $92,500 and $94,000 levels.
However, the bears were active near $94,500. A high was formed at $94,583 and the price recently corrected some gains. There was a drop toward the 50% Fib retracement level of the upward move from the $89,545 swing low to the $94,583 high.
However, the bulls were active near the $92,000 support. Bitcoin is now trading below $92,000 and the 100 hourly Simple moving average. Besides, there is a bullish trend line forming with support at $91,500 on the hourly chart of the BTC/USD pair.
If the bulls remain in action, the price could attempt another increase. Immediate resistance is near the $92,800 level. The first key resistance is near the $93,200 level. The next resistance could be $94,000. A close above the $94,000 resistance might send the price further higher. In the stated case, the price could rise and test the $94,500 resistance. Any more gains might send the price toward the $95,500 level. The next barrier for the bulls could be $96,200 and $96,500.
More Losses In BTC?
If Bitcoin fails to rise above the $94,000 resistance zone, it could start another decline. Immediate support is near the $92,000 level. The first major support is near the $91,500 level and the 61.8% Fib retracement level of the upward move from the $89,545 swing low to the $94,583 high.
The next support is now near the $90,750 zone. Any more losses might send the price toward the $90,000 support in the near term. The main support sits at $88,800, below which BTC might accelerate lower in the near term.
Technical indicators:
Hourly MACD – The MACD is now gaining pace in the bullish zone.
Hourly RSI (Relative Strength Index) – The RSI for BTC/USD is now above the 50 level.
Major Support Levels – $92,000, followed by $91,500.
Major Resistance Levels – $93,200 and $94,000.


You May Also Like

Cathie Wood’s ARK Invest Buys $13.7M in Circle Shares While Selling Robinhood Stock

The changing face of elder care in Malaysia — Sayed Mohammad Reza Yamani Sayed Umar

Not a loophole: Singapore AI export controls let China tap US AI legally


