Aave (AAVE) Price Prediction 2026, 2027-2030
- Bullish AAVE price prediction for 2026 is $337.91 to $500.02.
- Aave (AAVE) price might reach $550 soon.
- Bearish AAVE price prediction for 2026 is $149.88.
In this Aave (AAVE) price prediction 2026, 2027-2030, we will analyze the price patterns of AAVE by using accurate trader-friendly technical analysis indicators and predict the future movement of the cryptocurrency.
|
TABLE OF CONTENTS
|
|
INTRODUCTION
|
|
|
AAVE (AAVE) PRICE PREDICTION 2026
|
|
| AAVE (AAVE) PRICE PREDICTION 2027, 2028-2030 |
| CONCLUSION |
| FAQ |
Aave (AAVE) Current Market Status
| Current Price | $162.05 |
| 24 – Hour Price Change | 5.44% Up |
| 24 – Hour Trading Volume | $433.6M |
| Market Cap | $2.48B |
| Circulating Supply | 15.31M AAVE |
| All – Time High | $666.86 (On May 19, 2021) |
| All – Time Low | $26.02 (On Nov 05, 2020) – (CoinGecko) |
What is Aave (AAVE)
| TICKER | AAVE |
| BLOCKCHAIN | Ethereum |
| CATEGORY | Decentralized Lending System |
| LAUNCHED ON | November 2017 |
| UTILITIES | Governance, security, gas fees & rewards |
Aave (AAVE) is the native governance token of Aave, a crypto borrowing and lending DeFi protocol on Ethereum. Aave (AAVE) was launched in 2017 as ETHLend. The Aave protocol provides users to create and access liquidity pools for crypto-assets and real-world assets.
Aave also allows lenders to earn interest rates on locking in their assets in the pool. Borrowers also avail of crypto-backed loans via decentralized smart contracts. AAVE token grants voting rights to its holders to participate in the governance of the protocol. Users can also deploy AAVE tokens as collaterals in the Aave protocol. The third version of Aave, Aave v3, confers more interoperability to the Aave protocol.
Aave 24H Technicals
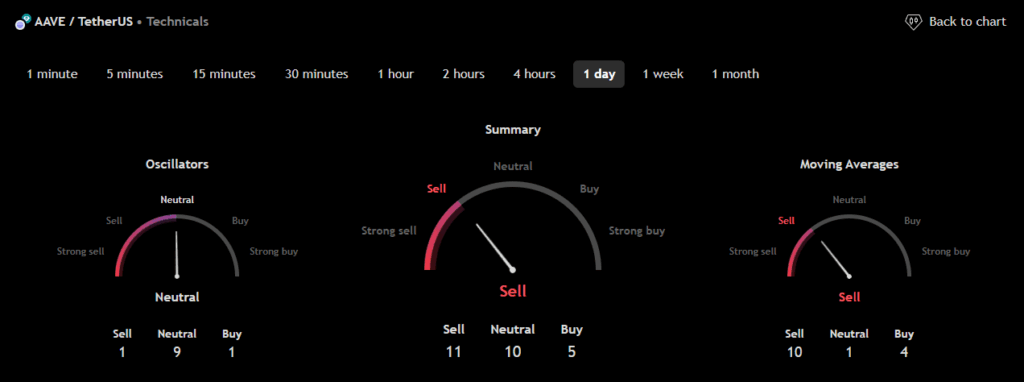 (Source: TradingView)
Aave (AAVE) Price Prediction 2026
Aave (AAVE) ranks 36th on CoinMarketCap in terms of its market capitalization. The overview of the Aave price prediction for 2026 is explained below with a daily time frame.
AAVE/USDT Ascending Triangle Pattern (Source: TradingView)
In the above chart, Aave (AAVE) laid out an Ascending Triangle pattern. The ascending triangle is a characteristic pattern of an ongoing bullish trend. This triangle is formed by a horizontal upper trendline that connects the highs, indicating a consistent level of resistance, and a lower trendline that connects the rising lows, reflecting increasing buying pressure.
As the price approaches the apex of the triangle, the tension between buyers and sellers intensifies. If the trend breaks out at the resistance level, the price will continue to move up in this ascending triangle pattern, often leading to further gains. Traders typically look for confirmation of the breakout, which can enhance the likelihood of a successful upward move.
At the time of analysis, the price of Aave (AAVE) was recorded at $162.05. If the pattern trend continues, then the price of AAVE might reach the resistance levels of $406.65 and $1,250.11. If the trend reverses, then the price of AAVE may fall to the support levels of $248.98 and $114.83.
Aave (AAVE) Resistance and Support Levels
The chart given below elucidates the possible resistance and support levels of Aave (AAVE) in 2026.
From the above chart, we can analyze and identify the following as resistance and support levels of Aave (AAVE) for 2026.
| Resistance Level 1 | $337.91 |
| Resistance Level 2 | $500.02 |
| Support Level 1 | $221.75 |
| Support Level 2 | $149.88 |
AAVE Resistance & Support Levels
Aave (AAVE) Price Prediction 2026 — RVOL, MA, and RSI
The technical analysis indicators such as Relative Volume (RVOL), Moving Average (MA), and Relative Strength Index (RSI) of Aave (AAVE) are shown in the chart below.
AAVE/USDT RVOL, MA, RSI (Source: TradingView)
From the readings on the chart above, we can make the following inferences regarding the current Aave (AAVE) market in 2026.
| INDICATOR | PURPOSE | READING | INFERENCE |
| 50-Day Moving Average (50MA) | Nature of the current trend by comparing the average price over 50 days | 50 MA = $301.35Price = $313.60 (50MA < Price) |
Bullish/Uptrend |
| Relative Strength Index (RSI) | Magnitude of price change;Analyzing oversold & overbought conditions | 50.30 <30 = Oversold 50-70 = Neutral>70 = Overbought |
Neutral |
| Relative Volume (RVOL) | Asset’s trading volume in relation to its recent average volumes | Below cutoff line | Weak Volume |
Aave (AAVE) Price Prediction 2026 — ADX, RVI
In the below chart, we analyze the strength and volatility of Aave (AAVE) using the following technical analysis indicators — Average Directional Index (ADX) and Relative Volatility Index (RVI).
AAVE/USDT ADX, RVI (Source: TradingView)
From the readings on the chart above, we can make the following inferences regarding the price momentum of Aave (AAVE).
| INDICATOR | PURPOSE | READING | INFERENCE |
| Average Directional Index (ADX) | Strength of the trend momentum | 16.82 | Weak Trend |
| Relative Volatility Index (RVI) | Volatility over a specific period | 44.56 <50 = Low >50 = High |
Low Volatility |
Comparison of AAVE with BTC, ETH
Let us now compare the price movements of Aave (AAVE) with those of Bitcoin (BTC) and Ethereum (ETH).
BTC Vs ETH Vs AAVE Price Comparison (Source: TradingView)
From the above chart, we can interpret that the price action of AAVE is dissimilar to that of BTC and ETH. That is, when the price of BTC and ETH increases, the price of AAVE decreases, if the price of BTC and ETH decreases, the price of AAVE increases.
Aave (AAVE) Price Prediction 2027, 2028 – 2030
With the help of the aforementioned technical analysis indicators and trend patterns, let us predict the price of Aave (AAVE) between 2027, 2028, 2029, and 2030.
| Year | Bullish Price | Bearish Price |
| Aave (AAVE) Price Prediction 2027 | $585 | $60 |
| Aave (AAVE) Price Prediction 2028 | $620 | $50 |
| Aave (AAVE) Price Prediction 2029 | $780 | $40 |
| Aave (AAVE) Price Prediction 2030 | $875 | $30 |
Conclusion
If Aave (AAVE) establishes itself as a good investment in 2026, this year would be favorable to the cryptocurrency. In conclusion, the bullish Aave (AAVE) price prediction for 2026 is $500.02. Comparatively, if unfavorable sentiment is triggered, the bearish Aave (AAVE) price prediction for 2026 is $149.88.
If the market momentum and investors’ sentiment positively elevate, then Aave (AAVE) might hit $550. Furthermore, with future upgrades and advancements in the Aave ecosystem, AAVE might surpass its current all-time high (ATH) of $666.86 and mark its new ATH.
FAQ
1. What is Aave (AAVE)?
Aave (AAVE) is the governance token of the Aave protocol, a DeFi crypto borrowing and lending platform. AAVE was launched in 2017.
2. Where can you buy Aave (AAVE)?
Traders can trade Aave (AAVE) on the following cryptocurrency exchanges Binance, Bitunix, OKX, Deepcoin, and Bybit.
3. Will Aave (AAVE) record a new ATH soon?
With the ongoing developments and upgrades within the Aave platform, Aave (AAVE) has a high possibility of reaching its ATH soon.
4. What is the current all-time high (ATH) of Aave (AAVE)?
Aave (AAVE) hit its current all-time high (ATH) of $666.86 on May 19, 2021.
5. What is the lowest price of Aave (AAVE)?
According to CoinMarketCap, AAVE hit its all-time low (ATL) of $26.02 on Nov 05, 2020.
6. Will Aave (AAVE) hit $550?
If Aave (AAVE) becomes one of the active cryptocurrencies that maintain a bullish trend, it might hit $550 soon.
7. What will be the Aave (AAVE) price by 2027?
Aave (AAVE) price might reach $585 by 2027.
8. What will be the Aave (AAVE) price by 2028?
Aave (AAVE) price might reach $620 by 2028.
9. What will be the Aave (AAVE) price by 2029?
Aave (AAVE) price might reach $780 by 2029.
10. What will be the Aave (AAVE) price by 2030?
Aave (AAVE) price might reach $875 by 2030.
Top Crypto Predictions
Algorand (ALGO) Price Prediction
BinaryX (BNX) Price Prediction
Shiba Inu (SHIB) Price Prediction
Disclaimer: The opinion expressed in this article is solely the author’s. It does not represent any investment advice. TheNewsCrypto team encourages all to do their own research before investing.


You May Also Like

ETH Enters High-Stakes Decision Zone

Stunned Navy secretary went to Trump disbelieving he'd actually been fired: report