

XRP’s Downtrend Shows Cracks — Are the Bulls Preparing A Counterstrike?
XRP remains under the weight of its long-standing downtrend, but recent price action suggests the bears may be losing their grip. Upward moves are becoming sharper and more impulsive, while downward momentum slows, hinting that buyers are quietly stepping in. With a decisive breakout above key resistance, the bulls could be gearing up for a significant counterstrike.
Overarching Bearish Structure: The Red Trend Line Cap
According to the latest XRP chart update by MakroVision Research, the broader market structure remains firmly within a downward trajectory, clearly outlined by the steeply declining red trend lines. These trend lines continue to cap every attempt at recovery, leaving the larger technical picture unchanged and leaning bearish.
Although the internal structure of the market has begun to show notable signs of improvement. Short-term price behavior reveals that upward movements are becoming more impulsive, faster, and more defined. At the same time, the downward phases are gradually slowing, taking longer to unfold and displaying less momentum.
This shift is a classic indication of fading selling pressure and increasing buyer activity at lower levels. The market may still be sitting below a dominant resistance zone, but its internal dynamics are no longer as weak as before.
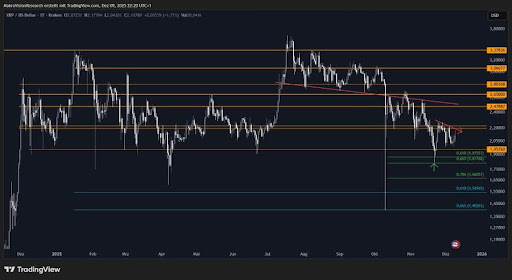
If XRP manages a decisive move above the red trend line around $2.48, it would unlock the bullish potential that has been quietly building beneath the surface. Without this breakout, the token remains technically under pressure, but the groundwork for a potential reversal is clearly forming.
Key price levels to watch include the $2.2 – $2.22 resistance zone, the major $2.48 breakout level, and the support region around $1.95 – $1.88, which aligns with both Fibonacci retracements and recent reaction points.
Dual Track Conflict: Bearish Trend Vs. Bullish Internal Structure
In conclusion, MakroVision Research has highlighted that XRP is currently positioned on a dual-track path. While the big trend remains technically downward, the internal price structure is becoming increasingly and noticeably bullish. This diminishing downward momentum makes the current chart highly exciting.
The immediate fate of XRP now depends entirely on whether the asset can achieve a sustainable breakout above the crucial resistance marks previously mentioned, specifically the $2.48 trend line. If XRP succeeds in converting that major resistance into support, the analyst warns that the built-up bullish momentum could unfold very quickly, leading to a rapid surge in price.
Currently, the critical question remains whether XRP can achieve a durable trend reversal and capitalize on its internal strength, or whether the overarching bearish pressure will ultimately prevail, forcing the price to fall deeper toward the significant $1.4 low.


You May Also Like

The changing face of elder care in Malaysia — Sayed Mohammad Reza Yamani Sayed Umar

Not a loophole: Singapore AI export controls let China tap US AI legally

Exclusive interview with Smokey The Bera, co-founder of Berachain: How the innovative PoL public chain solves the liquidity problem and may be launched in a few months


