Bitcoin Lacks Fresh Momentum As Realized Cap Growth Still Declining
On-chain data shows the Bitcoin Realized Cap Growth indicator has continued to decline recently, a sign new capital inflows lack momentum.
Bitcoin Realized Cap Growth Has Been Heading Down Recently
As explained by CryptoQuant community analyst Maartunn in a new post on X, the Bitcoin Realized Cap Growth has been trending lower recently. The “Realized Cap” is an on-chain capitalization model for BTC that calculates its total value by assuming the value of each individual token is equal to the spot price at which it was last transacted on the blockchain.
This is unlike the usual market cap, which simply calculates the total valuation of the asset by multiplying the number of tokens in circulation with the current spot price, considering the latest value of the cryptocurrency to be the one value for all coins.
In short, what the Realized Cap represents is the amount of capital that the Bitcoin investors as a whole used to purchase the asset’s supply. On the other hand, the market cap is the value that the investors are carrying in the present.
The Realized Cap itself isn’t the indicator of interest in the current discussion, but rather the Realized Cap Growth, measuring the 365-day changes occurring in the Realized Cap.
Changes in the indicator naturally reflect the amount of capital exiting or entering the cryptocurrency. In other words, the Realized Cap Growth contains information about the asset’s netflow.
Now, here is the chart shared by Maartunn that shows the trend in the 7-day and 59-day moving averages (MAs) of the Bitcoin Realized Cap Growth over the last few years:
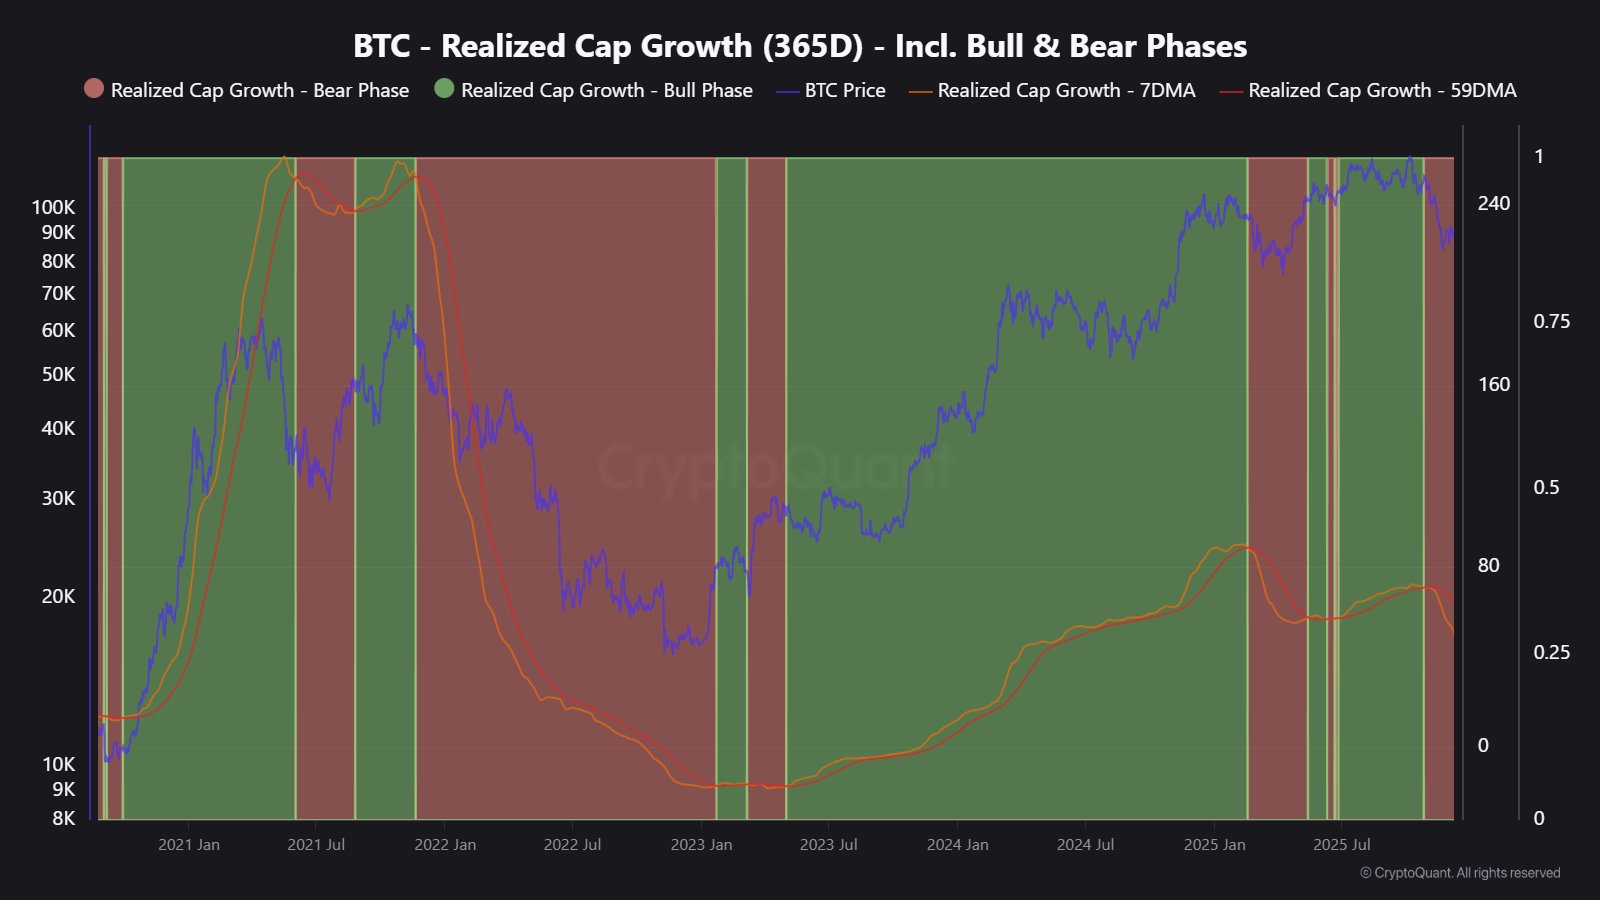
As displayed in the above graph, the Bitcoin Realized Cap Growth has witnessed both its 7-day and 59-day MAs reverse down recently, with the former line crossing under the latter.
The trend indicates that growth in the Realized Cap has been slowing down during the recent market downturn. “This suggests Bitcoin is lacking momentum from new cost basis inflows,” noted the analyst.
With the 7-day MA falling below the 59-day MA, the indicator is now flagging the current market to be in a “bear phase.” The last time this signal maintained for an extended duration was alongside BTC’s decline over the first few months of 2025. It now remains to be seen how long momentum from new capital inflows will stay weak for Bitcoin this time around.
In some other news, the Bitcoin short-term holders are still under a notable amount of stress, as CryptoQuant author IT Tech has pointed out in an X post.
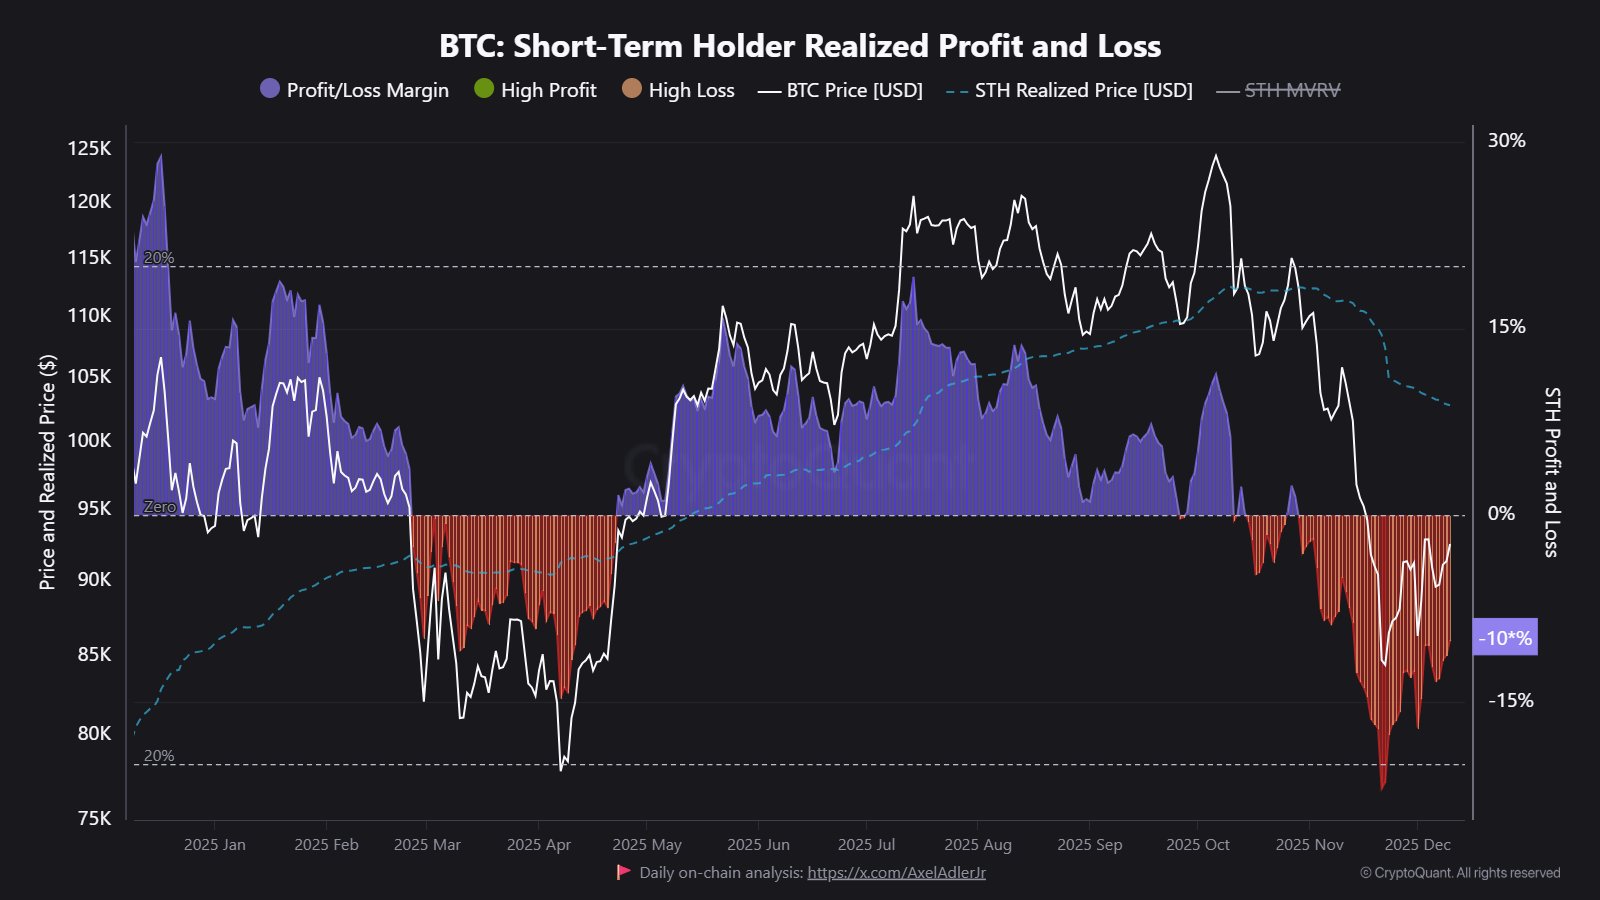
Short-term holders (STHs) are defined as the Bitcoin buyers who got into the market during the past 155 days. Despite the rebound BTC has seen since its November low, STHs are still in a loss of 10%.
BTC Price
At the time of writing, Bitcoin is floating around $92,400, down 1.5% over the last 24 hours.


You May Also Like

Metaplanet buys 5,075 Bitcoin in Q1 to become 3rd-largest treasury

The changing face of elder care in Malaysia — Sayed Mohammad Reza Yamani Sayed Umar

Covéa Chooses Shift Technology as Strategic Partner for Fraud and Risk Management