

XMR price shows resilience at $400 amid market bearish conditions: Could a new ATH be next?
XMR price holds firm at $400 despite broader market weakness, with reclaimed moving averages and strong support suggesting momentum may be building toward a new all-time high.
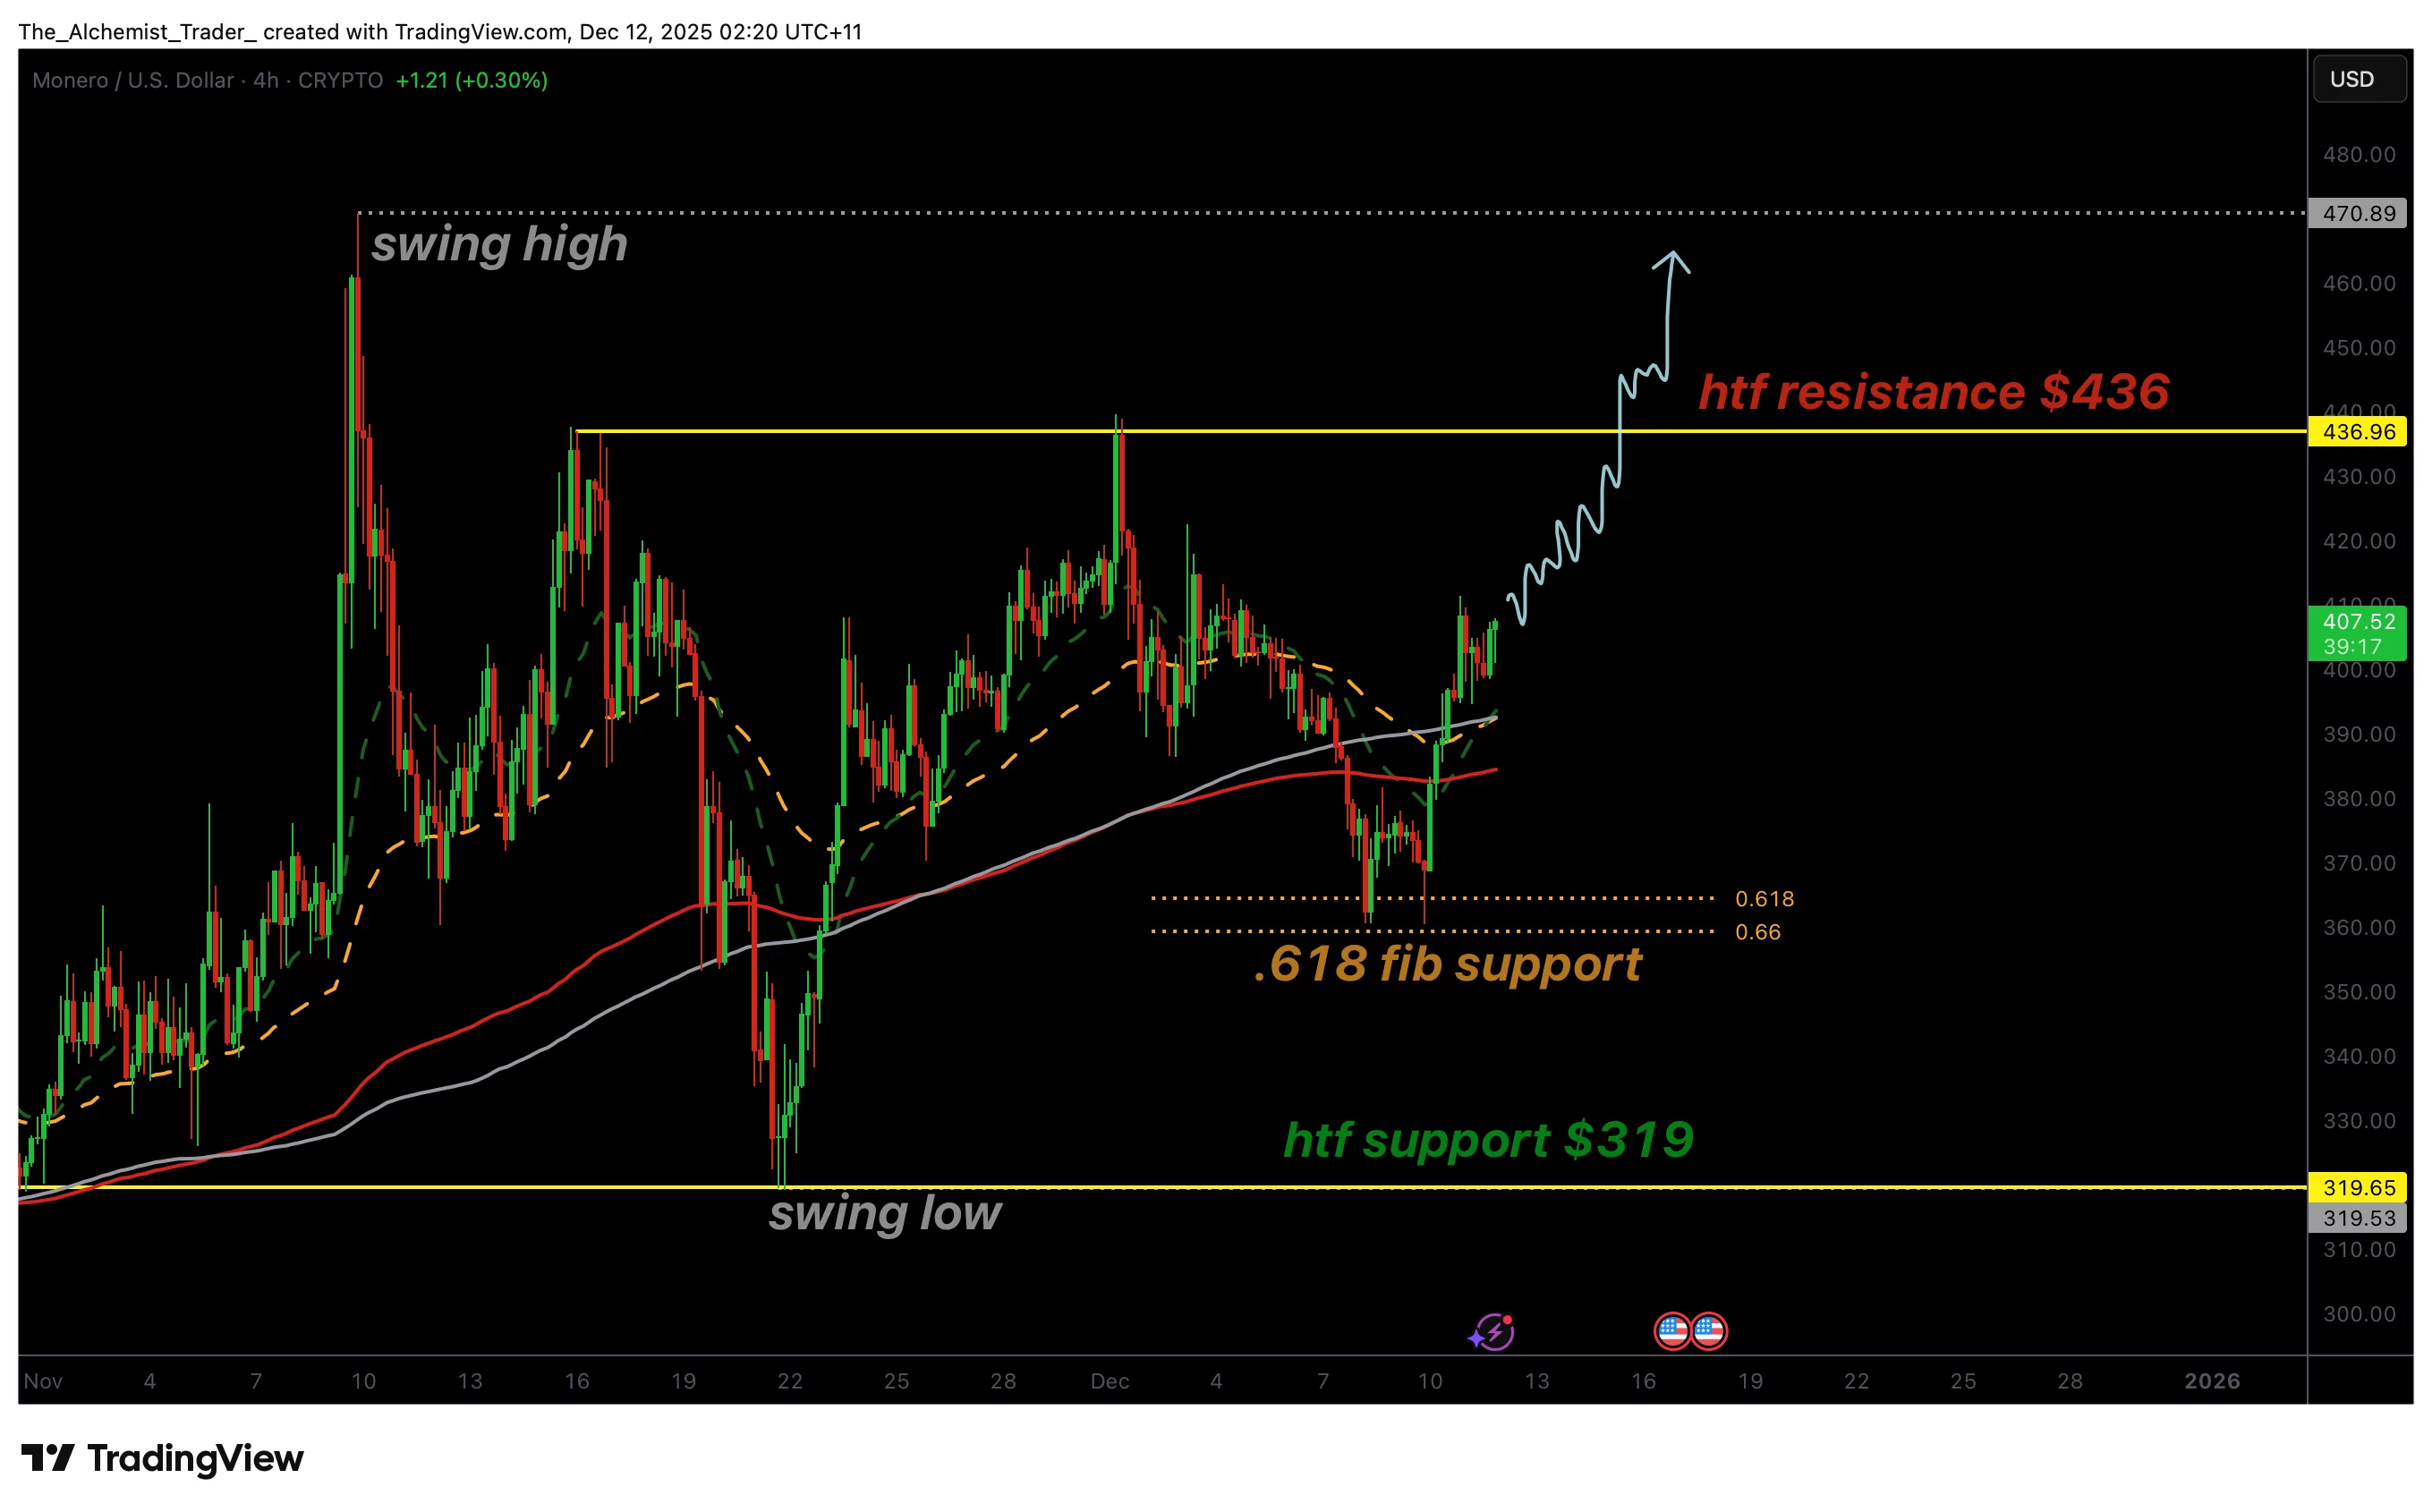
- XMR rebounds from the 0.618 Fibonacci level, forming a higher low.
- Price reclaims key moving averages, reinforcing bullish momentum.
- Break above $436 may trigger expansion toward a new all-time high.
Monero (XMR) price continues to stand out as one of the most technically resilient large-cap cryptocurrencies in a market environment where many assets are struggling to maintain key supports. Despite widespread bearish pressure, XMR has held firmly around the $400 level, reclaiming major moving averages and preserving its broader bullish market structure.
With strong support established and upside momentum re-emerging, traders are now questioning whether Monero may be positioning itself for a push toward a new all-time high (ATH).
Monero price key technical points
- XMR holds strong at the $400 support level, maintaining its bullish structure despite wider market weakness.
- Key resistance sits at $436, tested twice and now acting as the main ceiling before potential expansion.
- Reclaimed moving averages and a bounce from the 0.618 Fibonacci retracement support the case for continuation higher.
Monero’s price action has remained impressively strong compared to the broader market, which volatility and breakdowns across major assets have characterized. While many cryptocurrencies continue to trade below key moving averages, XMR has reclaimed these indicators, showing a clear shift in momentum back in favor of the bulls.
This structural strength has been anchored around the $400 level, a point that continues to act as a battleground for buyers and sellers, even as Zcash plunges 20% and Monero faces pressure while GHOST surges, highlighting the contrasting performances across the privacy-coin sector.
One of the strongest signals supporting XMR’s bullish outlook is the bounce from the 0.618 Fibonacci retracement, a region widely regarded by technical traders as a high-probability support level during uptrends. This bounce reinforces the idea that a higher low has formed, allowing the market to maintain its overall bullish trajectory. With price action now stabilizing above the reclaimed moving averages, the conditions for a continuation rally are beginning to solidify.
The next major level of interest is the $436 resistance zone. This level has been tested twice, each time triggering a corrective move. However, these corrections have not broken the broader trend. Instead, they have been followed by strong rebounds, suggesting accumulation and strength rather than exhaustion. The ability of XMR to repeatedly return to this resistance level highlights increasing buyer confidence and growing pressure beneath the surface.
Should XMR successfully reclaim and close above the $400 level on higher time frames, it would confirm a bullish continuation pattern, opening the pathway toward $433, $436, and beyond. More importantly, clearing the $436 resistance would invalidate any short-term bearish attempts and potentially trigger a bullish expansion phase, allowing price to challenge its previous all-time high levels.
From a market structure perspective, Monero is one of the few large-cap assets maintaining a clean bullish sequence of higher highs and higher lows. This structural integrity is essential for trend sustainability and increases the probability of continuation rather than reversal.
In addition, the strength shown during recent market volatility suggests that XMR is benefiting from a different investor profile than that of more speculative assets, one that values long-term fundamentals, privacy use cases, and reliable historical performance.
What to expect in the coming price action
If Monero maintains control above $400 and breaks through the $436 resistance, a bullish expansion toward a new ATH becomes increasingly likely. Failure to reclaim these levels would extend consolidation, but the broader structure remains decisively bullish.
You May Also Like

Impact of Iran war on Filipinos: What happens now?

How to earn from cloud mining: IeByte’s upgraded auto-cloud mining platform unlocks genuine passive earnings


