

Cardano (ADA) Price: Falls 10% as NIGHT Token Plummets 80% After Launch
TLDR
- Cardano price dropped 10% in 24 hours, falling below $0.45 to test support at $0.42
- Midnight Network’s NIGHT token crashed 80% from $150 to $0.050 after launch due to airdrop recipients selling
- 54% of active trading positions are short, showing bearish sentiment among traders
- ADA is testing critical support zone between $0.38-$0.39 with $750 million flowing to Binance
- Technical indicators show RSI at 40 (near oversold) and MACD displaying bearish signals
Cardano price has fallen 10% in the past 24 hours, dropping below the $0.45 level to currently trade at $0.42. The decline comes after the Federal Reserve’s recent interest rate cut triggered a broader market downturn.
 Cardano (ADA) Price
The entire crypto market experienced a 3% decline during the same period. ADA hit a low of $0.47 before testing support at the $0.43 level.
The price has bounced slightly from these lows. However, momentum remains weak unless ADA can reclaim the $0.438 to $0.440 range.
If the support zone holds, a recovery could be possible. But downward pressure may continue in the near term.
NIGHT Token Plunges 80% After Launch
The NIGHT token from Cardano’s Midnight Network has crashed 80% since its recent launch. The token initially surged to $150 after its introduction.
 Midnight (NIGHT) Price
NIGHT quickly collapsed and is now trading at approximately $0.050. The token fell an additional 6% in the last 24 hours.
The sudden drop was caused primarily by massive selling from airdrop recipients. Many holders who received the token through the airdrop began selling immediately.
This selling pressure caused the price to decline dramatically. Cardano founder Charles Hoskinson had promoted the release of Midnight as the most successful in Cardano’s history.
He emphasized the network’s capacity to manage large assets. Despite this, the token’s price volatility following launch highlights the challenges of dealing with speculative market behavior.
Trading data shows that 54% of active positions are short positions in the last 24 hours. The long-short ratio chart indicates a sharp increase in bearish bets, suggesting traders expect further price declines.
Critical Support Levels in Focus
ADA is currently testing a critical support area on the weekly chart from $0.322 to $0.437. This area aligns with several key technical analysis points and has produced a reaction at the Point of Control.
The area combines Fibonacci support with historical price action around $0.38-$0.39. This zone has seen substantial trading volume in the past.
High-volume nodes like this are viewed as strong support levels. The market is watching closely for signs of stabilization.
The MACD indicator shows a bearish trend with the blue line passing beneath the orange signal line. This suggests the possibility of further declines.
The RSI stands at 40, below the neutral 50 level. This indicates ADA is closer to oversold territory.
If ADA falls below the $0.42 support level, the price may drop toward $0.41. On the upside, Cardano needs to reclaim levels above $0.45 to target $0.50 for a potential bullish reversal.
A recent inflow of $750 million worth of ADA arrived on Binance. The market absorbed this whale buying pressure with minimal impact.
CVD held up well and open interest increased, keeping ADA above its regression line breakout. At the time of writing, ADA trades at $0.4128 with a 24-hour trading volume of $1.29 billion, up 24.63% over the last 24 hours.
The post Cardano (ADA) Price: Falls 10% as NIGHT Token Plummets 80% After Launch appeared first on CoinCentral.
You May Also Like
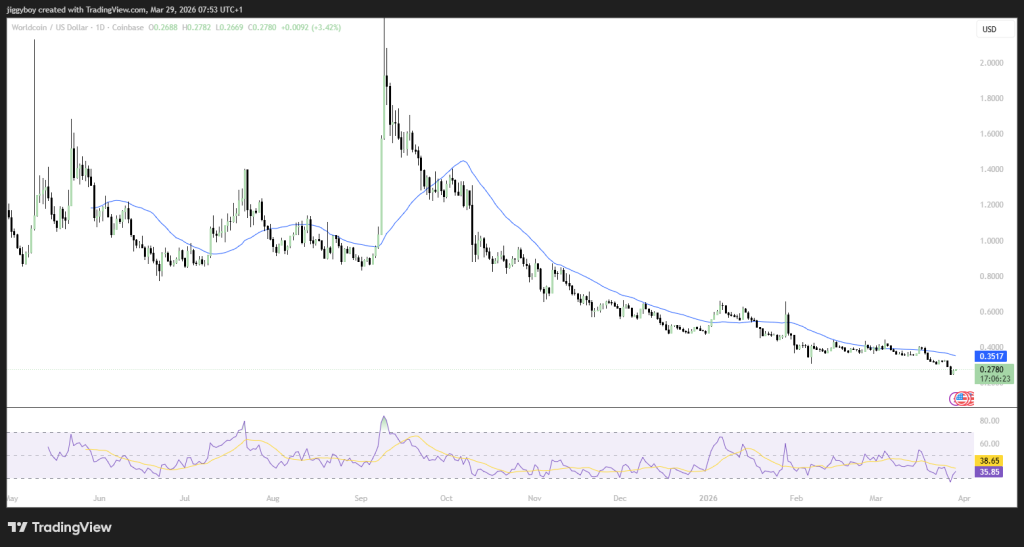
Crypto Price Prediction for Today, March 29: Worldcoin (WLD), XRP, Pi Coin
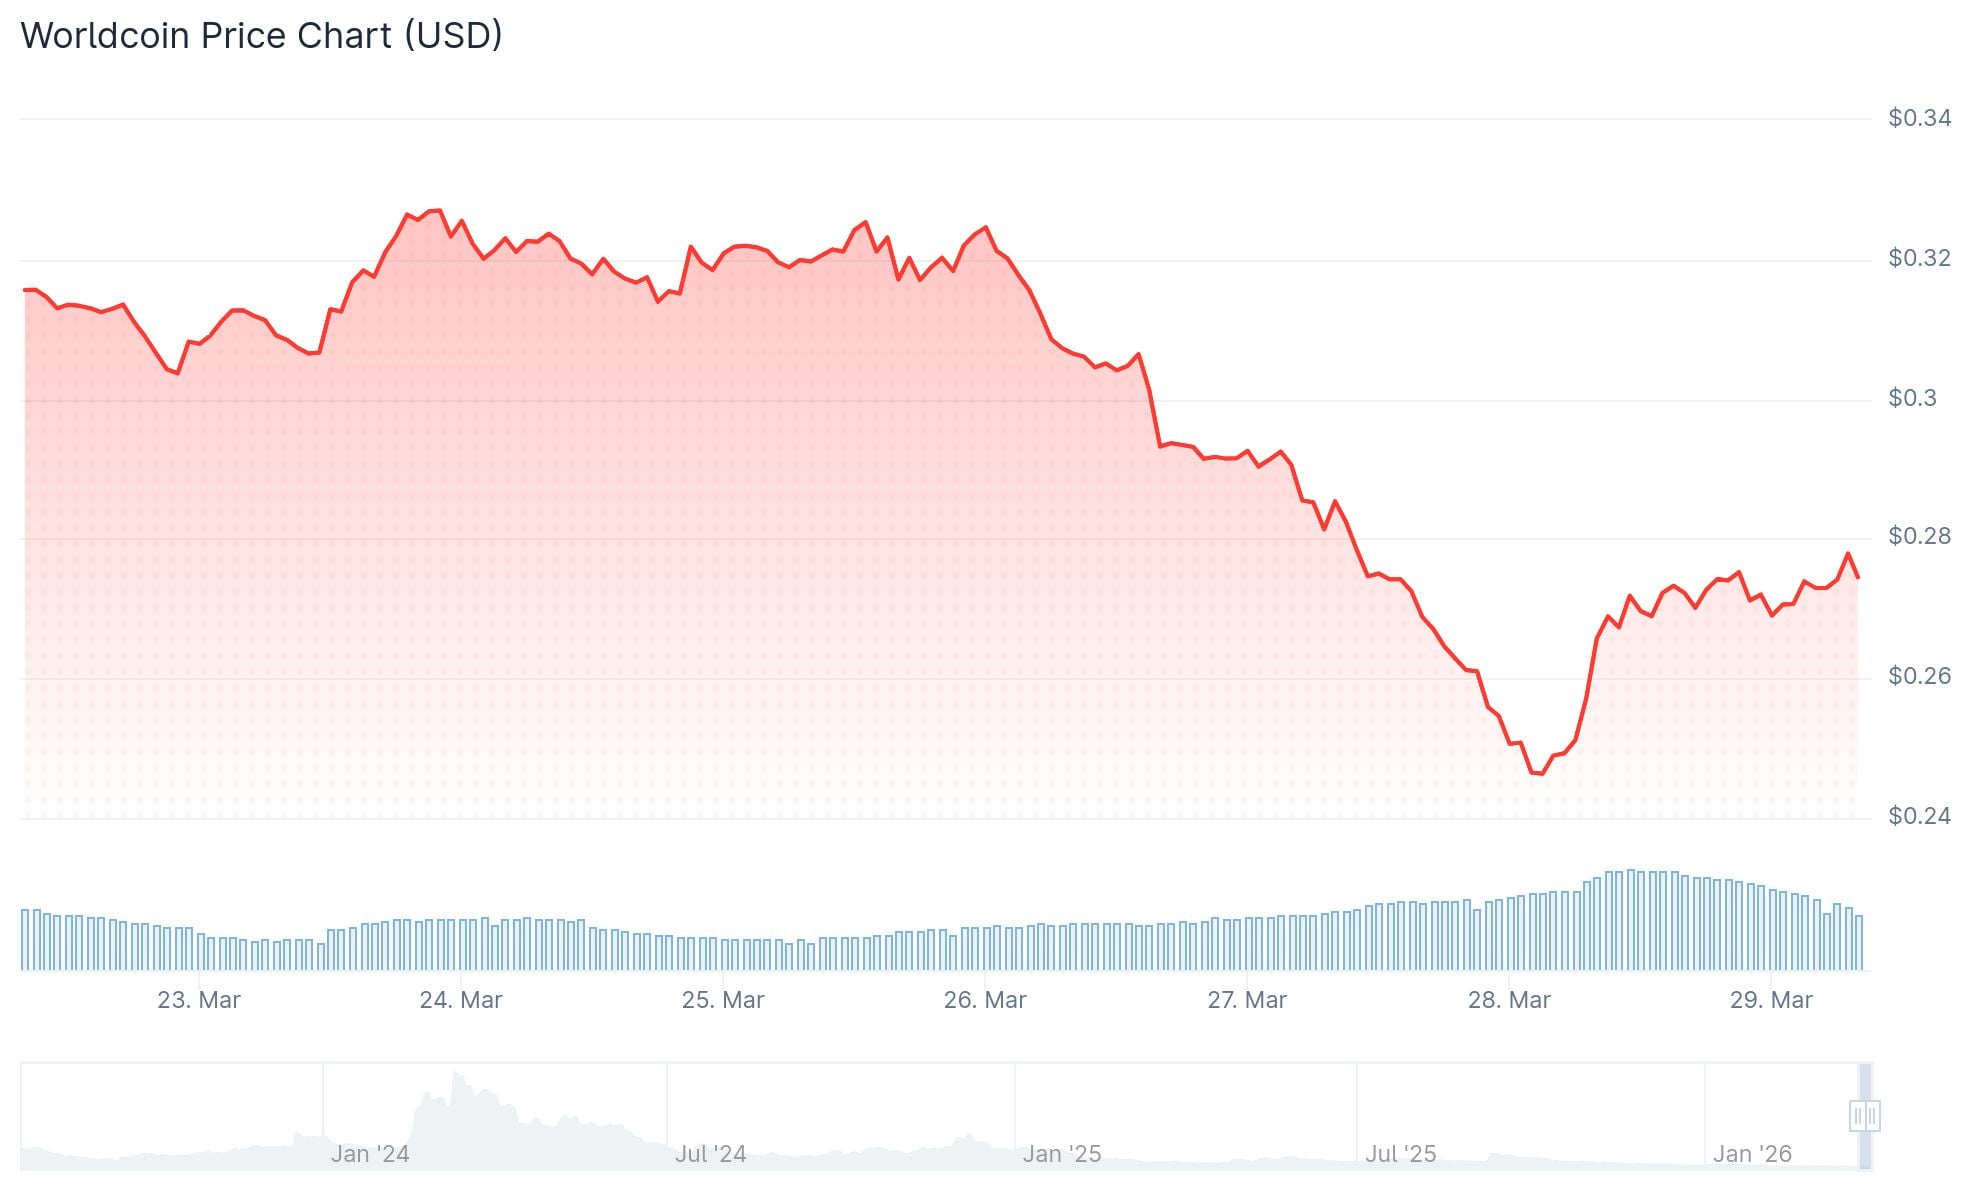
Worldcoin (WLD) Price: World Foundation Sells $65M in Tokens as WLD Hits All-Time Low


