Bitcoin price compresses within a tightening triangle, with repeated bounces from dynamic support suggesting volatility expansion and a decisive breakout approachingBitcoin price compresses within a tightening triangle, with repeated bounces from dynamic support suggesting volatility expansion and a decisive breakout approaching

Bitcoin price coils into a triangle pattern as a breakout draws closer

2025/12/16 00:27

Bitcoin price compresses within a tightening triangle, with repeated bounces from dynamic support suggesting volatility expansion and a decisive breakout approaching.

Summary
  • Bitcoin respects dynamic triangle support on multiple tests.
  • Value area and 0.618 Fibonacci confluence support the structure.
  • Breakout likely as price squeezes toward the triangle apex.

Bitcoin (BTC) price is entering a critical phase of consolidation as price action continues to coil within a well-defined triangular formation. This type of compression typically precedes a sharp volatility expansion, and with Bitcoin now trading closer to the apex of the pattern, a decisive breakout appears increasingly imminent.

While the directional bias remains undecided, multiple technical factors suggest that a significant move is approaching in the immediate short term.

Bitcoin price key technical points

  • Bitcoin respects dynamic triangle support, bouncing precisely from the lower trendline on multiple attempts.
  • Confluence between the value area and the 0.618 Fibonacci retracement strengthens the case for a bullish reaction.
  • Price is approaching a high-time-frame apex, increasing the probability of an imminent breakout.
Bitcoin price coils into a triangle pattern as a breakout draws closer - 1

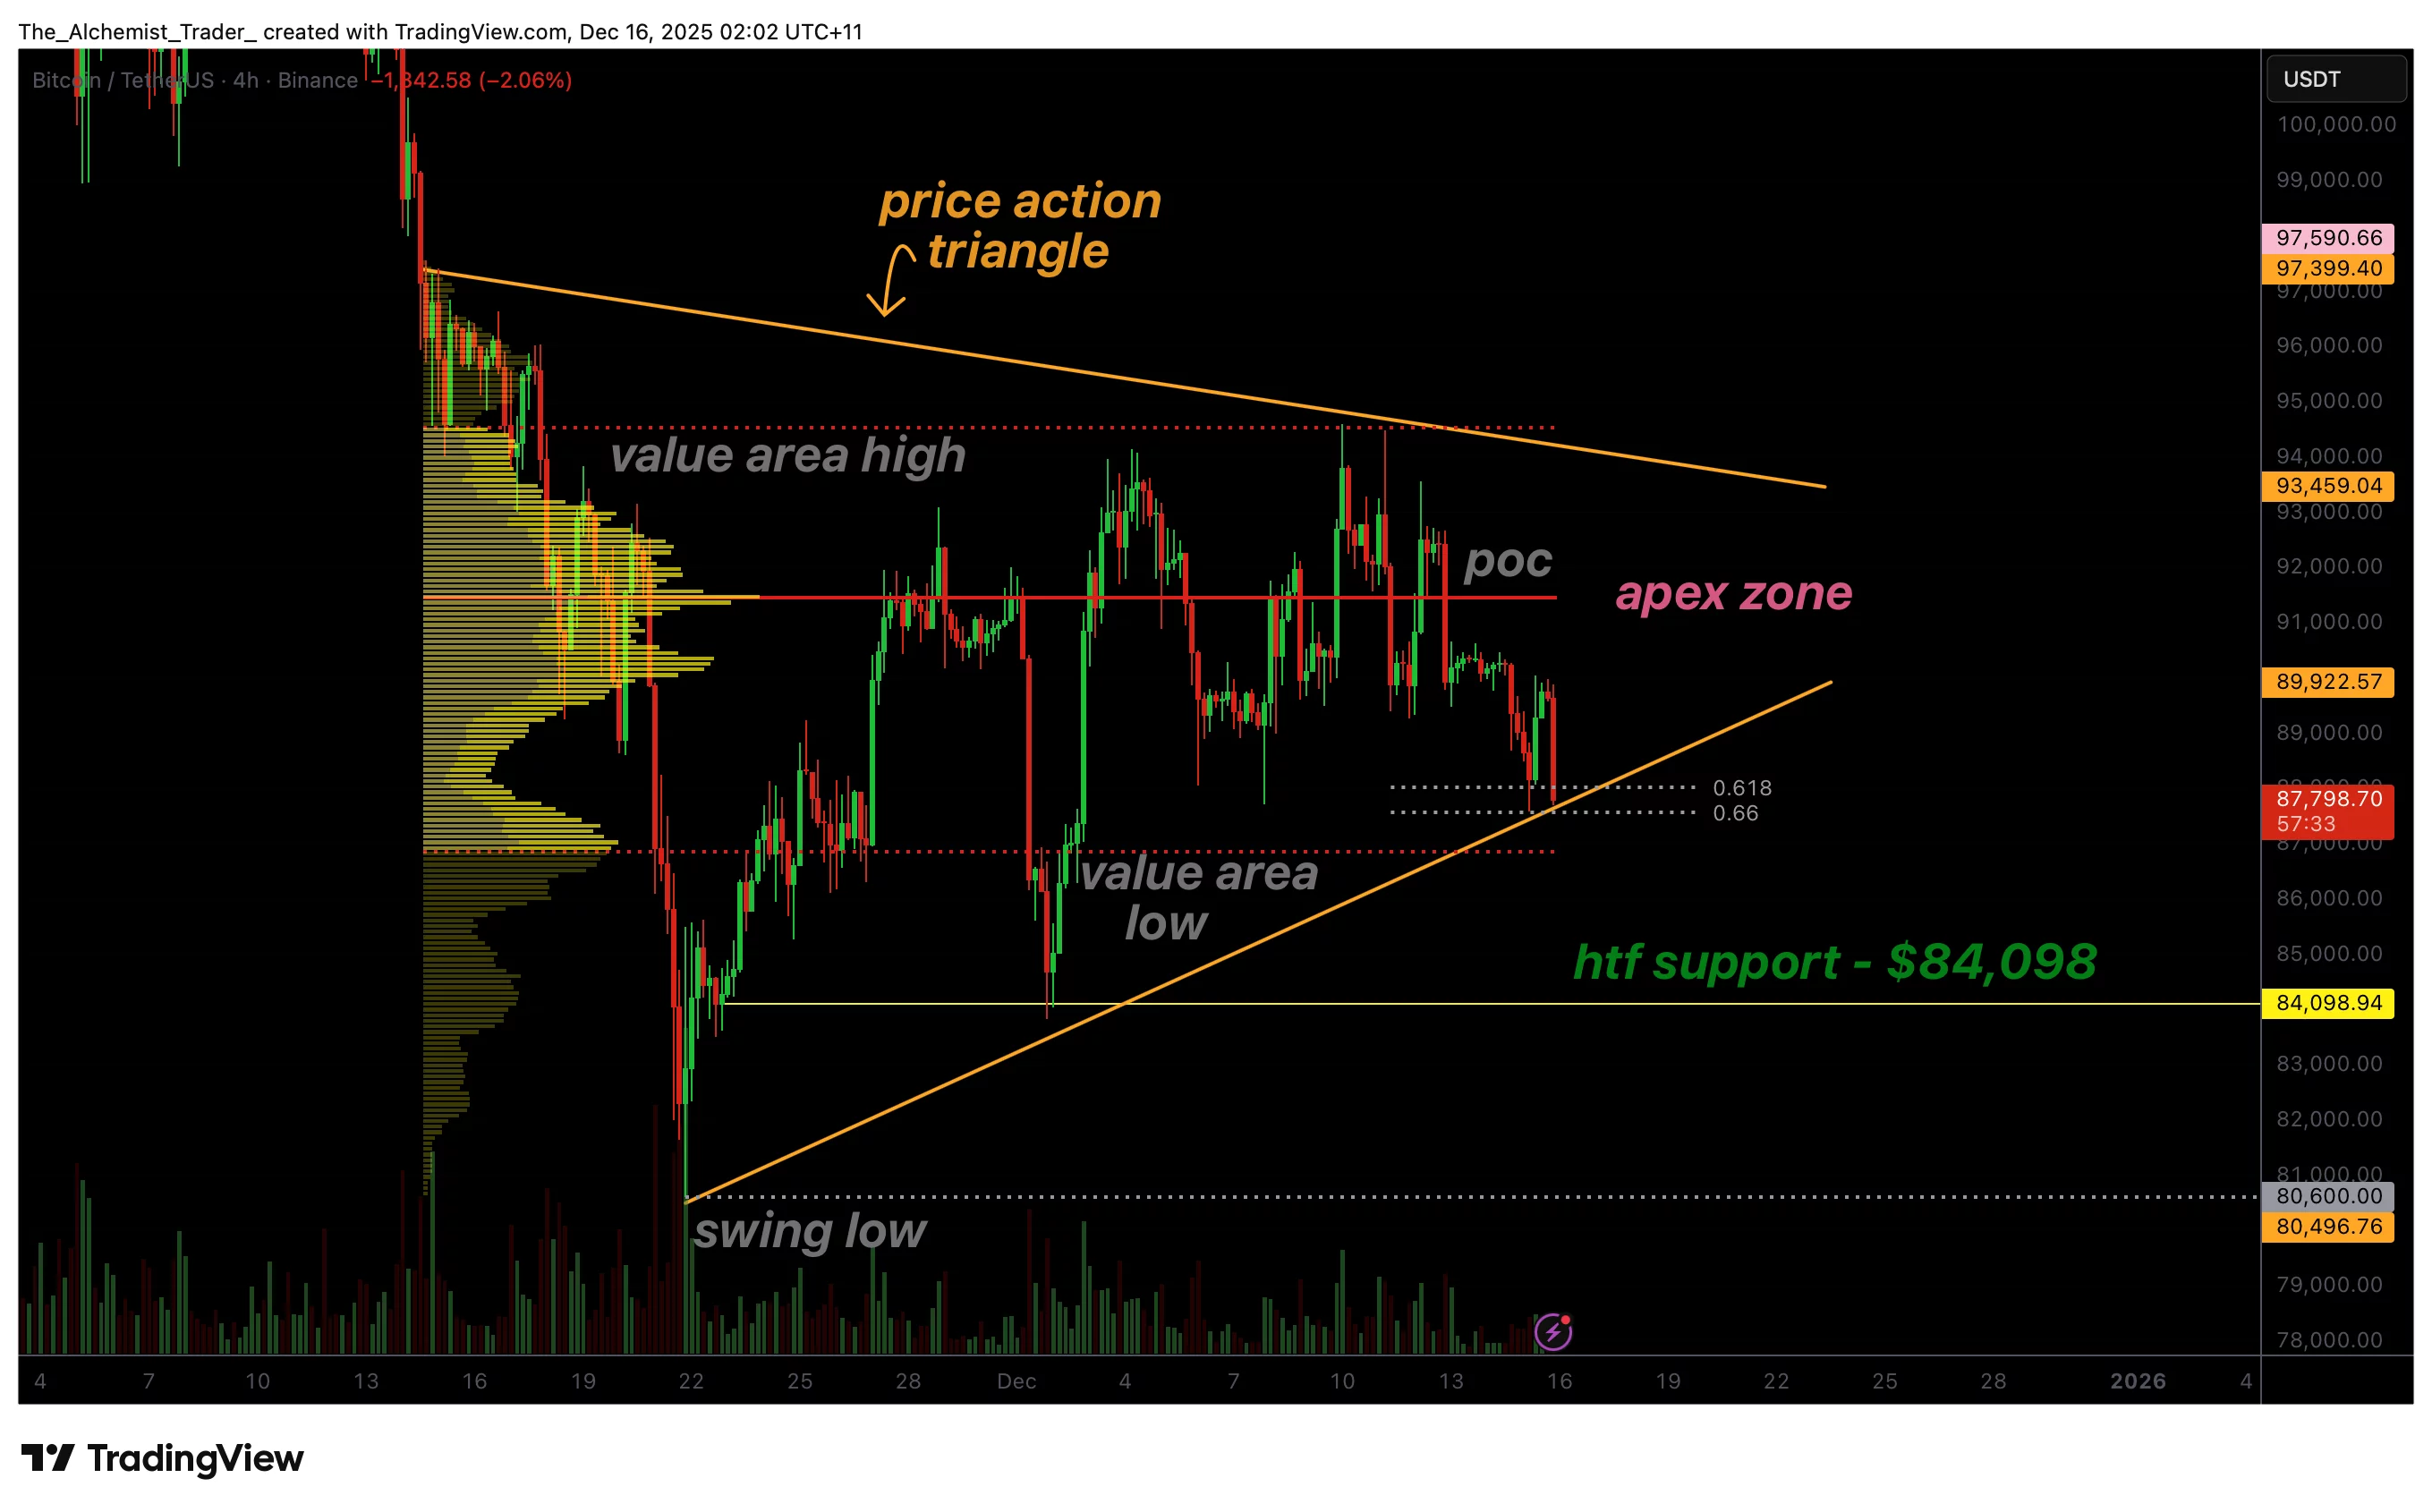
Bitcoin’s recent price action has been characterized by compression rather than directional movement. The asset continues to trade within a tightening triangular structure, marked by lower highs and higher lows.

This pattern reflects a market in equilibrium, where buying and selling pressures are gradually converging. As the range narrows, volatility decreases, a condition that historically precedes sharp directional moves, even as Strategy’s latest purchase of 10,625 Bitcoin highlights key risks facing MSTR stock, underscoring growing exposure tied to Bitcoin’s next decisive move.

A key technical observation is Bitcoin’s repeated reaction from the dynamic support at the lower boundary of the triangle. Price has respected this support “to the dollar” across multiple tests, indicating strong buyer interest at this level. Each successful defense reinforces the validity of the trendline and suggests that downside pressure is being absorbed rather than accelerated.

Adding to the bullish case is the confluence between the value area and the 0.618 Fibonacci retracement near the lower region of the triangle. Fibonacci retracement levels often act as high-probability reaction zones during consolidations, and when combined with volume-profile support, they form a compelling technical base. This alignment increases the likelihood that recent bounces are not random reactions, but part of a broader structural defense by buyers.

Despite this, Bitcoin remains confined within the triangle, indicating that the breakout direction has not yet been confirmed. The upper boundary of the pattern continues to cap upside attempts, preventing the price from transitioning into an impulsive rally. This balance between support and resistance reflects indecision, not weakness, and is typical behavior ahead of significant market moves.

From a market-structure perspective, the ongoing compression suggests that liquidity is building on both sides of the range. Breakouts from triangular formations often target these liquidity pools, leading to rapid follow-through once the move begins.

As price squeezes further into the apex, the probability of false moves decreases and the likelihood of a sustained breakout increases, especially as Bitcoin faces downside risk toward $75K amid looming Bank of Japan uncertainty, which could act as a catalyst for a sharper directional move.

While short-term price action remains neutral within the pattern, the broader setup favors preparedness rather than prediction. Traders should focus on the structure itself rather than attempting to front-run the move, as confirmation will come through a decisive break and close beyond the triangle’s boundaries.

What to expect in the coming price action

Bitcoin is likely to break out once the price fully compresses into the apex of the triangle. Until then, consolidation may persist, but volatility expansion is increasingly probable in the short term, with direction confirmed upon a breakout.

Disclaimer: The articles reposted on this site are sourced from public platforms and are provided for informational purposes only. They do not necessarily reflect the views of MEXC. All rights remain with the original authors. If you believe any content infringes on third-party rights, please contact [email protected] for removal. MEXC makes no guarantees regarding the accuracy, completeness, or timeliness of the content and is not responsible for any actions taken based on the information provided. The content does not constitute financial, legal, or other professional advice, nor should it be considered a recommendation or endorsement by MEXC.

You May Also Like

Wormhole Unveils W Token 2.0 with Enhanced Tokenomics

Wormhole Unveils W Token 2.0 with Enhanced Tokenomics

The post Wormhole Unveils W Token 2.0 with Enhanced Tokenomics appeared on BitcoinEthereumNews.com. Joerg Hiller Sep 17, 2025 13:57 Wormhole introduces W Token 2.0, featuring upgraded tokenomics, a strategic Wormhole Reserve, and a 4% base yield, aiming to optimize ecosystem growth and align incentives. Wormhole has announced a significant upgrade to its native token, unveiling the W Token 2.0. This upgrade introduces new tokenomics including the establishment of a Wormhole Reserve, a 4% base yield, and an optimized unlock schedule, marking a pivotal development in the ecosystem, according to Wormhole. The W Token Evolution Launched in October 2020, Wormhole’s W token has been central to the platform’s mission of creating a connected internet economy. The latest upgrade aims to enhance the token’s utility across more than 40 blockchains. With a capped supply of 10 billion, the W token supports governance, staking, and ecosystem growth, aligning incentives for network security and development. Introducing the Wormhole Reserve The Wormhole Reserve will accumulate value from both onchain and offchain activities, supporting the ecosystem’s expansion. As Wormhole adoption grows, the token will capture value through network expansions and ecosystem applications, ensuring that growth is directly reflected in the token’s value. 4% Base Yield and Governance Rewards Wormhole 2.0 introduces a 4% base yield for W holders who actively participate in governance. The yield, derived from existing token supplies and protocol revenues, is designed to incentivize active participation without inflating the token supply. Optimized Unlock Schedule Updating its token release schedule, Wormhole replaces annual cliffs with bi-weekly unlocks, starting October 3, 2025. This change aims to reduce market pressure and provide a more stable environment for investors and contributors. The bi-weekly schedule will span over 4.5 years, affecting categories such as Guardian Nodes and Community & Launch. Wormhole’s Future Vision With these upgrades, Wormhole aims to expand its role as…
Share
BitcoinEthereumNews2025/09/18 15:48
[OPINION] US National Security Strategy 2025: An iconoclastic document

[OPINION] US National Security Strategy 2025: An iconoclastic document

Trump's national security strategy signals a radical shift in US foreign policy, prioritizing economic power and regional interests over global commitments
Share
Rappler2025/12/16 12:30
Crucial US Stock Market Update: What Wednesday’s Mixed Close Reveals

Crucial US Stock Market Update: What Wednesday’s Mixed Close Reveals

BitcoinWorld Crucial US Stock Market Update: What Wednesday’s Mixed Close Reveals The financial world often keeps us on our toes, and Wednesday was no exception. Investors watched closely as the US stock market concluded the day with a mixed performance across its major indexes. This snapshot offers a crucial glimpse into current investor sentiment and economic undercurrents, prompting many to ask: what exactly happened? Understanding the Latest US Stock Market Movements On Wednesday, the closing bell brought a varied picture for the US stock market. While some indexes celebrated gains, others registered slight declines, creating a truly mixed bag for investors. The Dow Jones Industrial Average showed resilience, climbing by a notable 0.57%. This positive movement suggests strength in some of the larger, more established companies. Conversely, the S&P 500, a broader benchmark often seen as a barometer for the overall market, experienced a modest dip of 0.1%. The technology-heavy Nasdaq Composite also saw a slight retreat, sliding by 0.33%. This particular index often reflects investor sentiment towards growth stocks and the tech sector. These divergent outcomes highlight the complex dynamics currently at play within the American economy. It’s not simply a matter of “up” or “down” for the entire US stock market; rather, it’s a nuanced landscape where different sectors and company types are responding to unique pressures and opportunities. Why Did the US Stock Market See Mixed Results? When the US stock market delivers a mixed performance, it often points to a tug-of-war between various economic factors. Several elements could have contributed to Wednesday’s varied closings. For instance, positive corporate earnings reports from certain industries might have bolstered the Dow. At the same time, concerns over inflation, interest rate policies by the Federal Reserve, or even global economic uncertainties could have pressured growth stocks, affecting the S&P 500 and Nasdaq. Key considerations often include: Economic Data: Recent reports on employment, manufacturing, or consumer spending can sway market sentiment. Corporate Announcements: Strong or weak earnings forecasts from influential companies can significantly impact their respective sectors. Interest Rate Expectations: The prospect of higher or lower interest rates directly influences borrowing costs for businesses and consumer spending, affecting future profitability. Geopolitical Events: Global tensions or trade policies can introduce uncertainty, causing investors to become more cautious. Understanding these underlying drivers is crucial for anyone trying to make sense of daily market fluctuations in the US stock market. Navigating Volatility in the US Stock Market A mixed close, while not a dramatic downturn, serves as a reminder that market volatility is a constant companion for investors. For those involved in the US stock market, particularly individuals managing their portfolios, these days underscore the importance of a well-thought-out strategy. It’s important not to react impulsively to daily movements. Instead, consider these actionable insights: Diversification: Spreading investments across different sectors and asset classes can help mitigate risk when one area underperforms. Long-Term Perspective: Focusing on long-term financial goals rather than short-term gains can help weather daily market swings. Stay Informed: Keeping abreast of economic news and company fundamentals provides context for market behavior. Consult Experts: Financial advisors can offer personalized guidance based on individual risk tolerance and objectives. Even small movements in major indexes can signal shifts that require attention, guiding future investment decisions within the dynamic US stock market. What’s Next for the US Stock Market? Looking ahead, investors will be keenly watching for further economic indicators and corporate announcements to gauge the direction of the US stock market. Upcoming inflation data, statements from the Federal Reserve, and quarterly earnings reports will likely provide more clarity. The interplay of these factors will continue to shape investor confidence and, consequently, the performance of the Dow, S&P 500, and Nasdaq. Remaining informed and adaptive will be key to understanding the market’s trajectory. Conclusion: Wednesday’s mixed close in the US stock market highlights the intricate balance of forces influencing financial markets. While the Dow showed strength, the S&P 500 and Nasdaq experienced slight declines, reflecting a nuanced economic landscape. This reminds us that understanding the ‘why’ behind these movements is as important as the movements themselves. As always, a thoughtful, informed approach remains the best strategy for navigating the complexities of the market. Frequently Asked Questions (FAQs) Q1: What does a “mixed close” mean for the US stock market? A1: A mixed close indicates that while some major stock indexes advanced, others declined. It suggests that different sectors or types of companies within the US stock market are experiencing varying influences, rather than a uniform market movement. Q2: Which major indexes were affected on Wednesday? A2: On Wednesday, the Dow Jones Industrial Average gained 0.57%, while the S&P 500 edged down 0.1%, and the Nasdaq Composite slid 0.33%, illustrating the mixed performance across the US stock market. Q3: What factors contribute to a mixed stock market performance? A3: Mixed performances in the US stock market can be influenced by various factors, including specific corporate earnings, economic data releases, shifts in interest rate expectations, and broader geopolitical events that affect different market segments uniquely. Q4: How should investors react to mixed market signals? A4: Investors are generally advised to maintain a long-term perspective, diversify their portfolios, stay informed about economic news, and avoid impulsive decisions. Consulting a financial advisor can also provide personalized guidance for navigating the US stock market. Q5: What indicators should investors watch for future US stock market trends? A5: Key indicators to watch include upcoming inflation reports, statements from the Federal Reserve regarding monetary policy, and quarterly corporate earnings reports. These will offer insights into the future direction of the US stock market. Did you find this analysis of the US stock market helpful? Share this article with your network on social media to help others understand the nuances of current financial trends! To learn more about the latest stock market trends, explore our article on key developments shaping the US stock market‘s future performance. This post Crucial US Stock Market Update: What Wednesday’s Mixed Close Reveals first appeared on BitcoinWorld.
Share
Coinstats2025/09/18 05:30