

XRP Price Slides 4% As Peter Brandt Warns Of Bearish Double Top Risk
The XRP price slid 4% over the past 24 hours to trade at $1.83 as of 2:42 a.m. EST on trading volume that surged 37% to $3.8 billion.
The drop comes as veteran trader Peter Brandt warns of a potential bearish technical setup for XRP.
In a post on X, Brandt told traders that the asset may be forming a double-top pattern on the weekly chart.
A double top, if confirmed, often signals a possible bearish trend reversal and exerts bearish pressure on an asset.
Brandt added that while the pattern could fail, it currently carries bearish implications.
“This is a potential double top,” he said. “Sure, it may fail, and I will handle it if it does. But for now, this has bearish implications. Love it or not, you need to deal with it.”
The Ripple token is down 26.5% year-to-date and 14% over the last month, mirroring the broader crypto market’s slump.
Will the XRP price continue to fall?
XRP Price Analysis: Bears Take Control As Price Nears Key Support
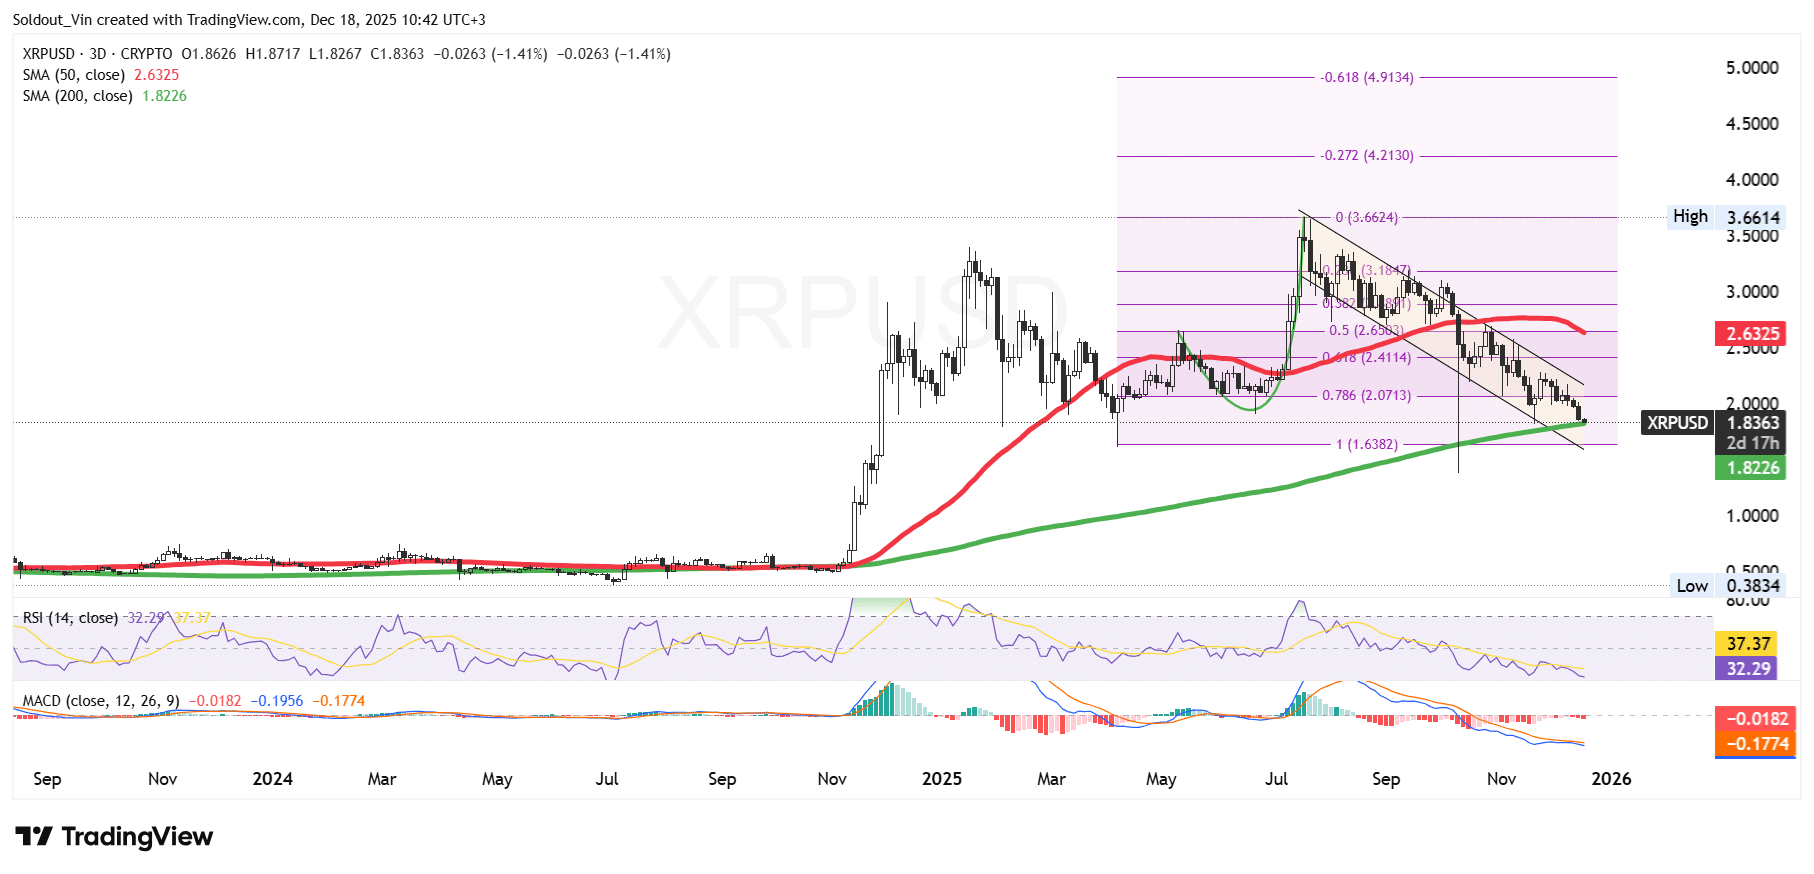
The XRP price, back in June, used the 0.786 Fibonacci level to surge through a parabolic curve, reaching an all-time high around $3.66 in July.
However, the Ripple token bulls could not hold this level, as sellers started booking profits, pushing the price down within a falling channel pattern and repossessing the previous support areas, which now act as resistance zones on the Fibonacci Retracement chart.
XRP bears seem to be in total control, as the price is now nearing the long-term support around the 200-day Simple Moving Average (SMA) at $1.82, which, if breached, could result in the asset falling even further.
The short-term indicator also shows that the price of XRP could be in a bearish trend, as the 50-day SMA remains above $2.63.
Meanwhile, the Relative Strength Index has also flipped negative, dropping to 32, a signal that sellers are still in control.
Moreover, the Moving Average Convergence Divergence (MACD) on the 3-day chart shows that the price of the Ripple token has lost momentum, as the orange signal line has crossed above the blue MACD line.
 XRP/USD Chart Analysis Source: TradingView
Ripple Token Price Risks Drop To $1.63
According to the XRP/USD chart analysis, the Ripple token could continue to drop, as major indicators have flipped negative.
The first key support lies on the 200-day SMA at $1.82. If bears break below this key support, the next support area is on the 1 Fib level at $1.6382, which also acts as a cushion against further downward pressure.
Conversely, the 200-day SMA could act as a strong support area. If bulls hold this support, XRP could stage a trend reversal, targeting the 0.618 and 0.5 Fib zones at $2.41 and $2.65, respectively.
Related News:


You May Also Like

Real Prize Casino: Exciting Online Games

Signs of Hope Emerge for Ethereum’s Market Trajectory


