

Bitcoin Price Prediction: BTC Faces $80K Drop in Potential Bear Shift
TLDR
- Bitcoin breaks key structural support as RSI slips below the 50 level.
- Descending channel continues to cap BTC recoveries below resistance.
- Failed trendline retest confirms sellers’ control and downside risk.
- A break below $86K–$88K could accelerate a move toward $80K.
Bitcoin price is showing growing signs of structural weakness as multiple timeframes point to a potential transition into a broader bearish phase. Recent chart analyses highlight declining momentum, repeated resistance rejections, and downside targets clustering between $80,000 and $50,000 if key levels fail. Analysts are closely monitoring momentum indicators and trendline behavior for confirmation of the next major move.
Momentum Signals Possible BTC Price Bear Regime
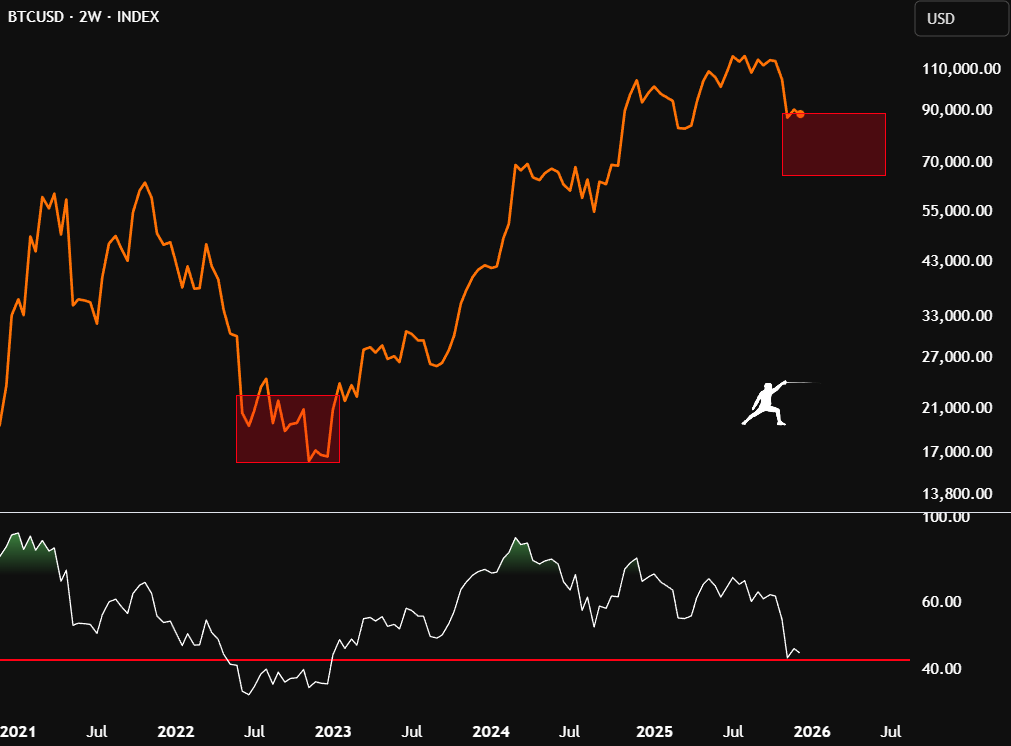
Analyst Rekt Fencer’s two-week chart shows that Bitcoin price has broken key structural support following a multi-year parabolic advance. The chart indicates a decisive shift after mid-2025 consolidation failed, marking the first major trend violation since the bull cycle began. Price weakness is now reinforced by the Relative Strength Index slipping below the 50 level, a zone historically linked to bearish regimes.
SOURCE: X
Moreover, RSI hovering near 40 suggests limited historical support if selling accelerates. Previous cycles show that breaks below this level often precede extended drawdowns. Fading upside volume further weakens bullish conviction, raising the risk of deeper declines toward the $50,000 area if momentum deteriorates further.
Descending Channel Caps Short-Term Bitcoin Price
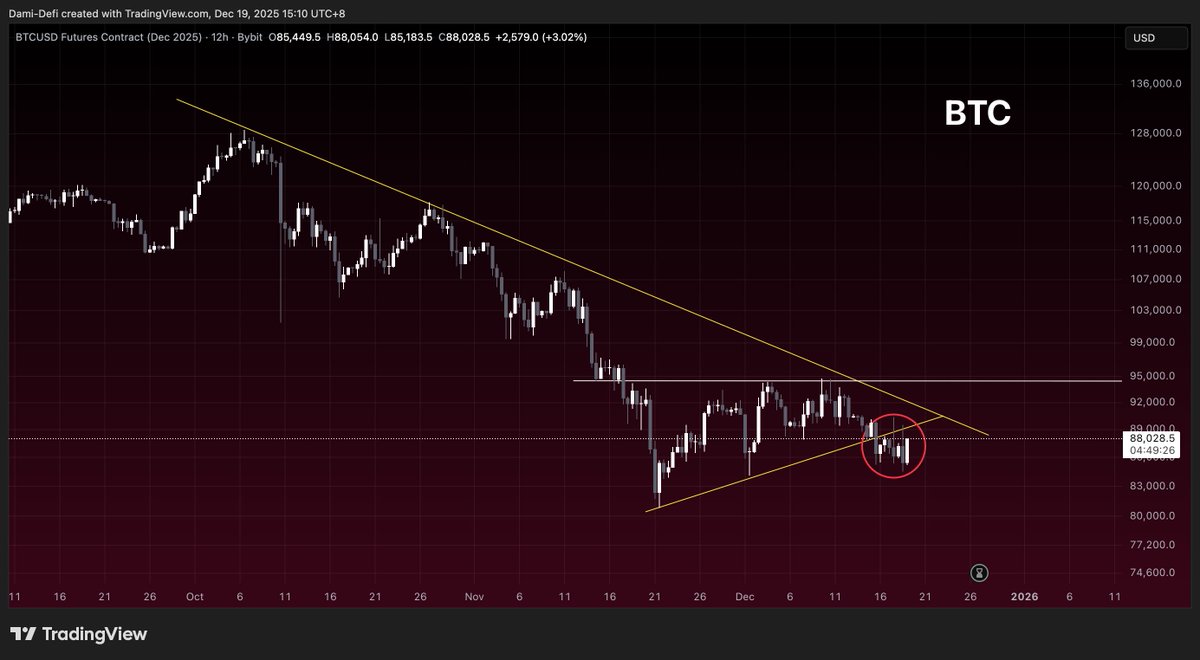
Meanwhile, according to Dami-Defi’s 12-hour futures chart, Bitcoin price remains trapped inside a well-defined descending channel. Since the October peak above $110,000, each recovery attempt has stalled below the falling resistance trendline. The most recent rejection near $89,000 reinforces the pattern of lower highs and persistent seller control.
SOURCE: X
Additionally, price compression near the lower boundary around $86,000 to $88,000 suggests a directional breakout is approaching. With futures markets amplifying volatility, a downside break could trigger liquidation-driven moves toward $80,000. Bulls would need a decisive close above channel resistance to invalidate the bearish setup.
Retest Failure Confirms Downside Risk
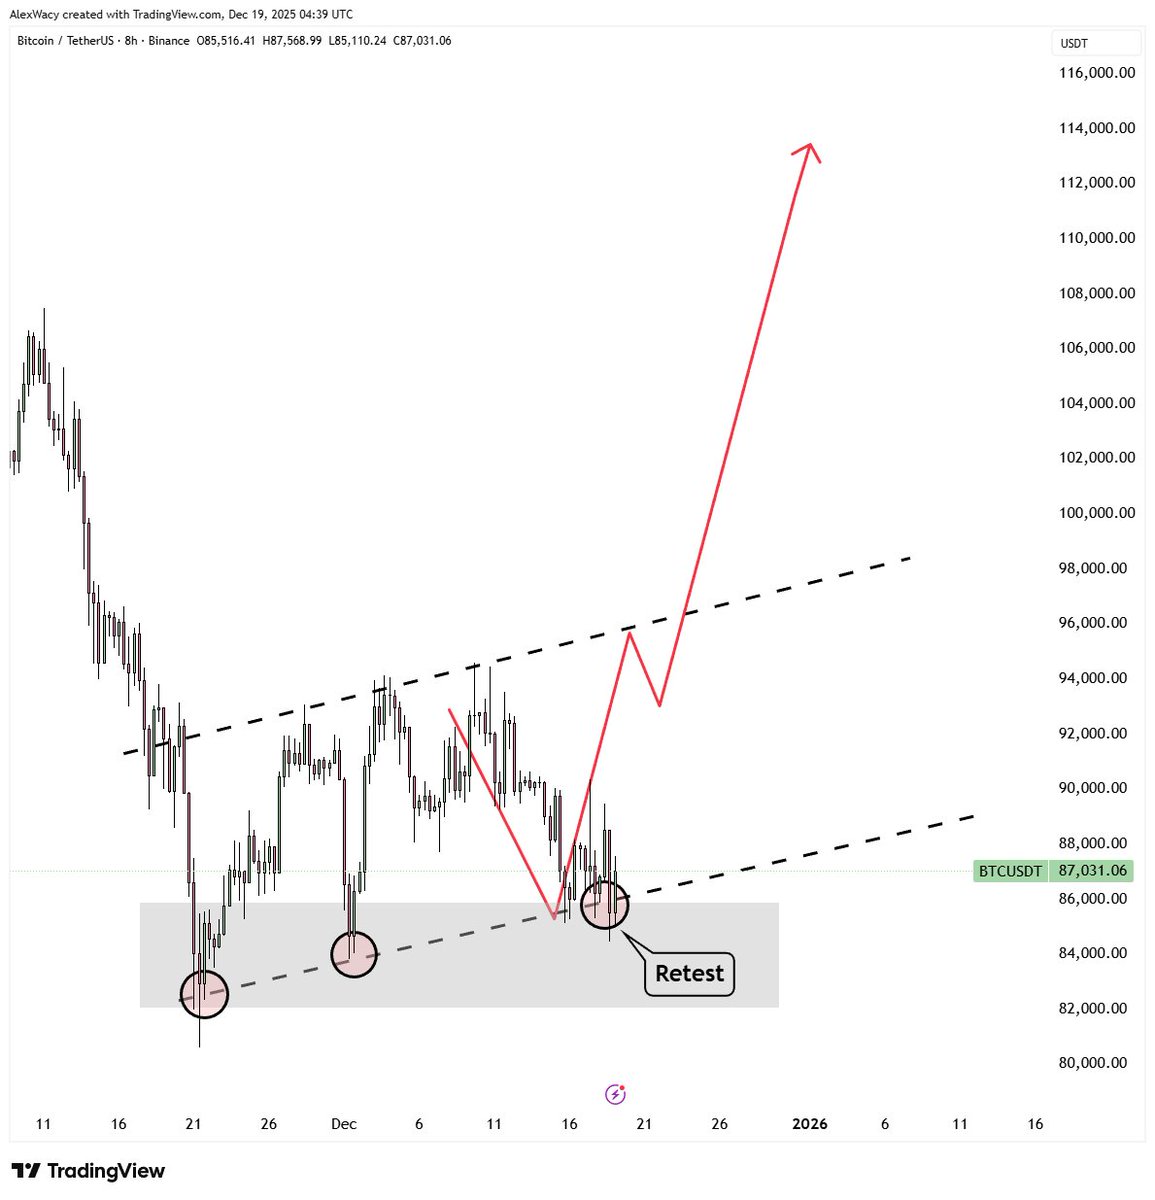
Furthermore, AlΞx Wacy’s eight-hour chart highlights a failed retest of a broken ascending trendline. Bitcoin price briefly spiked into the $87,000 to $89,000 zone before rejecting, confirming this zone as new resistance. Such retest failures often precede continuation moves, especially when accompanied by rising sell volume.
In addition, volume behavior during the retest signals distribution rather than accumulation. Downside projections extend toward the $80,000 to $82,000 range, aligning with broader corrective targets. While short-term volatility could produce relief rallies, momentum currently favors further weakness unless resistance is reclaimed.
More so, the convergence of long-term momentum loss, short-term trend resistance, and failed retests places Bitcoin price at a critical juncture. Relief rallies may continue to face selling pressure until momentum indicators stabilize and key trendlines are reclaimed.
While upside volatility remains possible, particularly in leveraged markets, current structures favor a defensive outlook. Investors are watching closely for confirmation signals, as the coming weeks may define whether this correction deepens into a sustained bear phase or stabilizes above major support zones.
The post Bitcoin Price Prediction: BTC Faces $80K Drop in Potential Bear Shift appeared first on CoinCentral.


You May Also Like

Hims & Hers (HIMS) Stock Tumbles 7% Following $300M Convertible Notes Announcement

Strategic Move: ZeroStax’s $107M 0G Token Acquisition Accelerates Decentralized AI Infrastructure Race


