Solana Price Eyes $160 as Bullish Reversal Signals Begin to Align
TLDR
- Short-term charts show SOL under bearish pressure below a descending resistance line.
- Failure to reclaim $126 weekly could expose downside toward the $80–$90 zone.
- A long-term cup-and-handle pattern supports upside targets near $160–$180.
- Volume and structure suggest accumulation despite near-term volatility risks.
Solana is trading at a technical crossroads as analysts highlight conflicting short-term weakness and longer-term recovery structures. While near-term charts show persistent selling pressure, higher-timeframe patterns suggest the groundwork for a renewed advance. Market focus is now split between downside risk toward key supports and upside targets stretching into early 2026.
Solana Price Pressured by Short-Term Downtrend
According to analyst Ali, the one-hour chart shows Solana locked in a steady decline since early December. Lower highs continue to form beneath a descending resistance line that has capped rebounds from $149 to the current $123 zone. Increased sell-side volume on red candles confirms that bears remain in control of the short-term trend.
SOURCE: X
Moreover, former support zones at $138 and $134 have flipped into resistance, reinforcing overhead pressure. Price compression near $123 suggests a possible relief bounce, but historical price action shows similar setups often resolve with sharp volatility. Without a decisive break above the trendline, downside risk remains elevated.
Ali noted that a confirmed breakout could open the door to a recovery toward $130–$135. Conversely, failure to reclaim resistance may expose Solana to a deeper move toward $118.50. Volume behavior around the trendline is expected to determine the next directional move.
Inverse Pattern Raises Breakdown Concerns
Meanwhile, analyst Hardy highlighted a long-term inverse head and shoulders formation on the weekly chart. The structure spans from 2022, with a neckline positioned near $126. While such patterns typically signal bullish reversal, the recent rejection at the neckline raises caution.
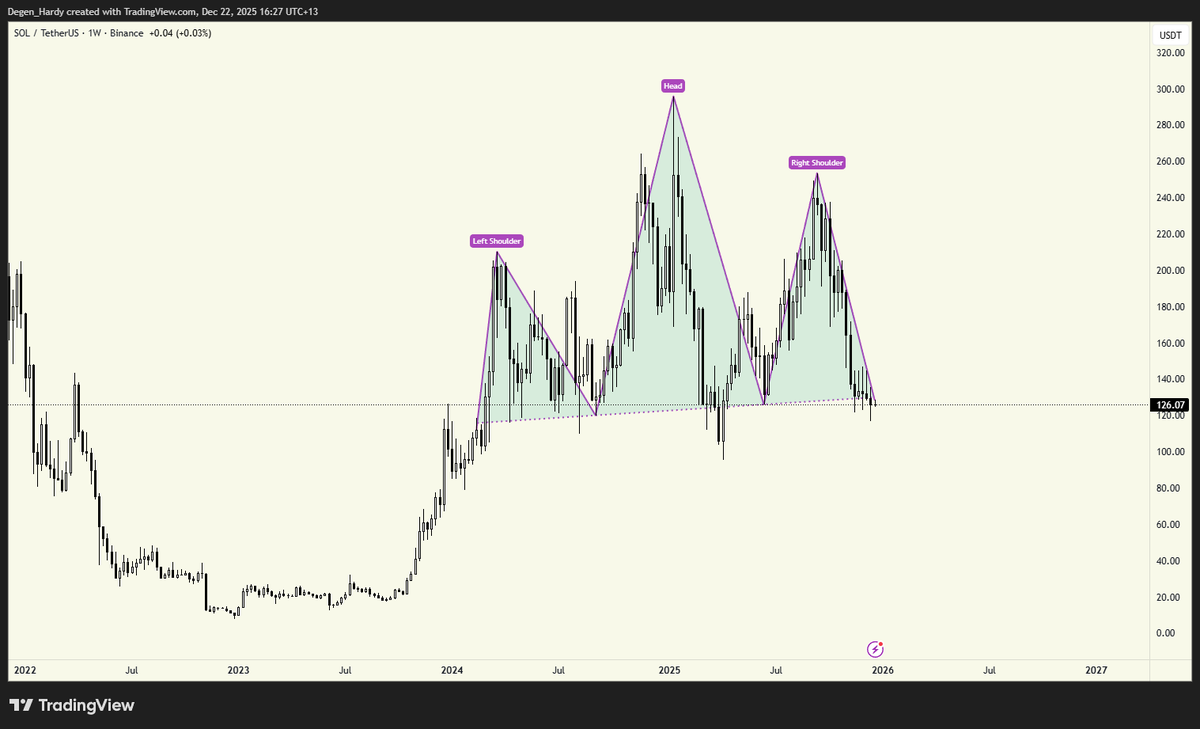
Additionally, volume has not confirmed a sustained breakout, weakening the pattern’s reliability. The right shoulder shows fading momentum, increasing the risk that the structure may fail. In past crypto cycles, similar setups have transitioned into distribution tops during broader market weakness.
Most importantly, an invalidation could trigger a deeper correction toward the $80–$90 range. A decisive weekly close above $126 is required to restore confidence in this bullish reversal. Until then, Solana price remains vulnerable to market sentiment.
Cup-and-Handle Structure Supports $160 SOL Price Outlook
In contrast, analyst BitBull presents a more constructive long-term view based on a large cup and handle formation. The pattern stretches from 2023 through 2026, with a rounded base near $10 and a handle retracement holding above $89. This structure is often associated with accumulation phases before strong trend continuation.
SOURCE: X
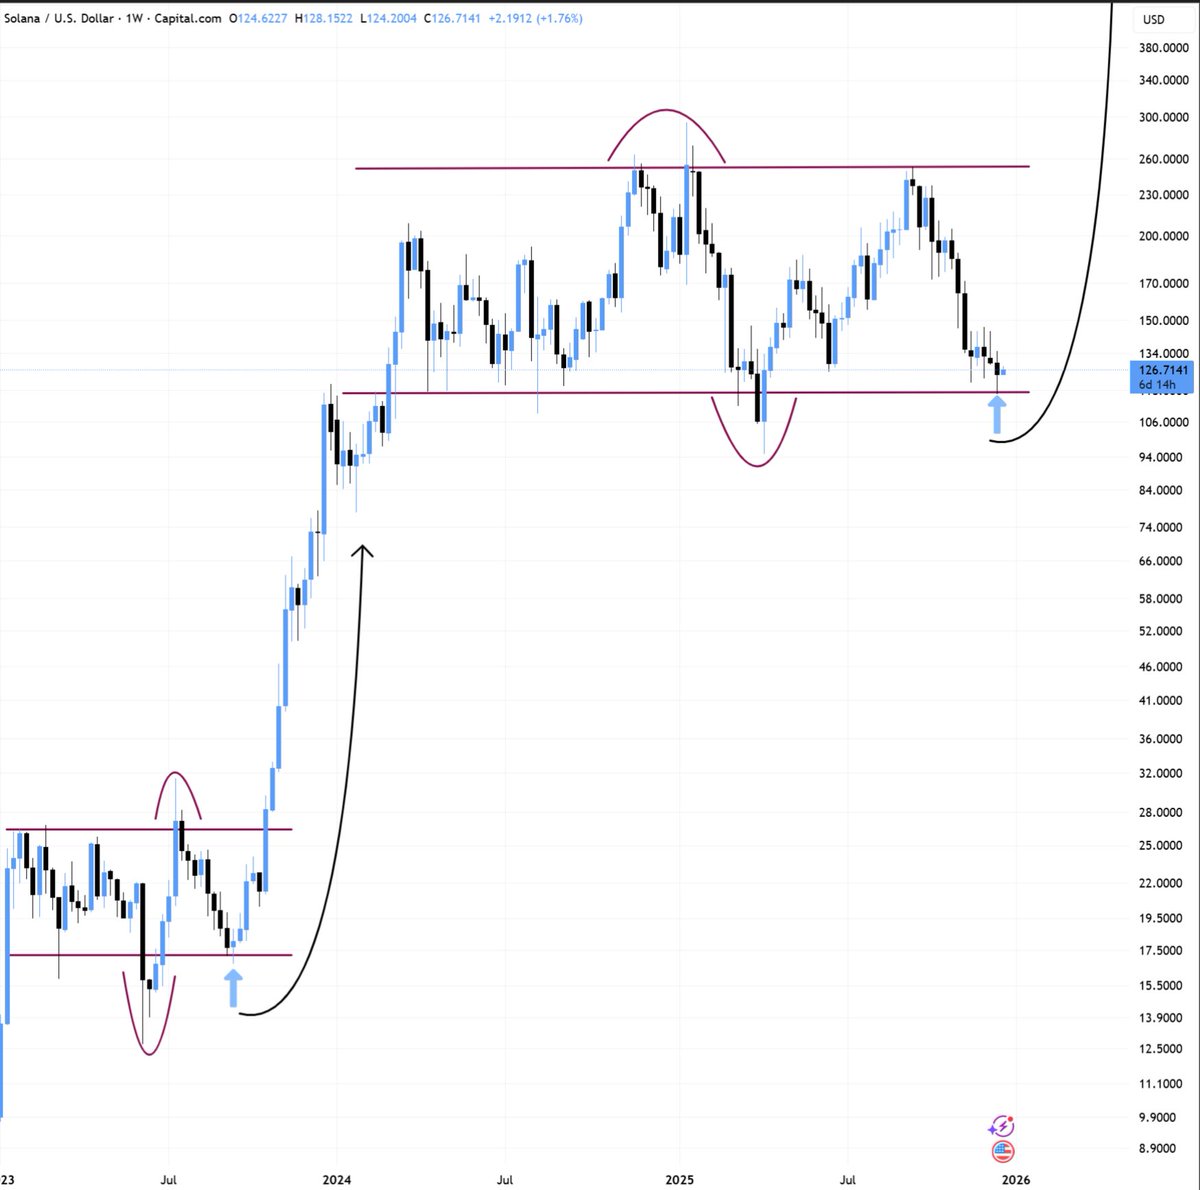
Furthermore, volume behavior aligns with classic technical expectations. Participation increased during the cup formation and tapered during the handle, suggesting weak hands were flushed out. Such conditions have historically preceded sustained upside moves in altcoin markets.
Moreover, a brief sweep of the $90–$100 support zone would still fit the bullish framework. If the pattern resolves as expected, upside projections extend toward $160–$180 in early 2026. This scenario positions longer-term buyers favorably, provided macro conditions remain supportive.
Overall, Solana faces near-term technical pressure while longer-term structures continue to attract attention from market participants. The next weeks may prove decisive in determining whether downside risks dominate or a recovery begins to take shape.
The post Solana Price Eyes $160 as Bullish Reversal Signals Begin to Align appeared first on CoinCentral.


You May Also Like

Not a loophole: Singapore AI export controls let China tap US AI legally

Q2 Market Insights: Bitcoin regains dominance in risk-averse environment, ETFs remain critical to market structure

Crypto Market Drops as Fear Grows and Major Assets Decline