

Bitcoin value at $87k: capitulation risk or the start of a larger downtrend?

Markets are confronting a sharp shift in risk appetite as Bitcoin value trades lower, forcing traders to reassess whether this is just another shakeout or the start of something structurally deeper.
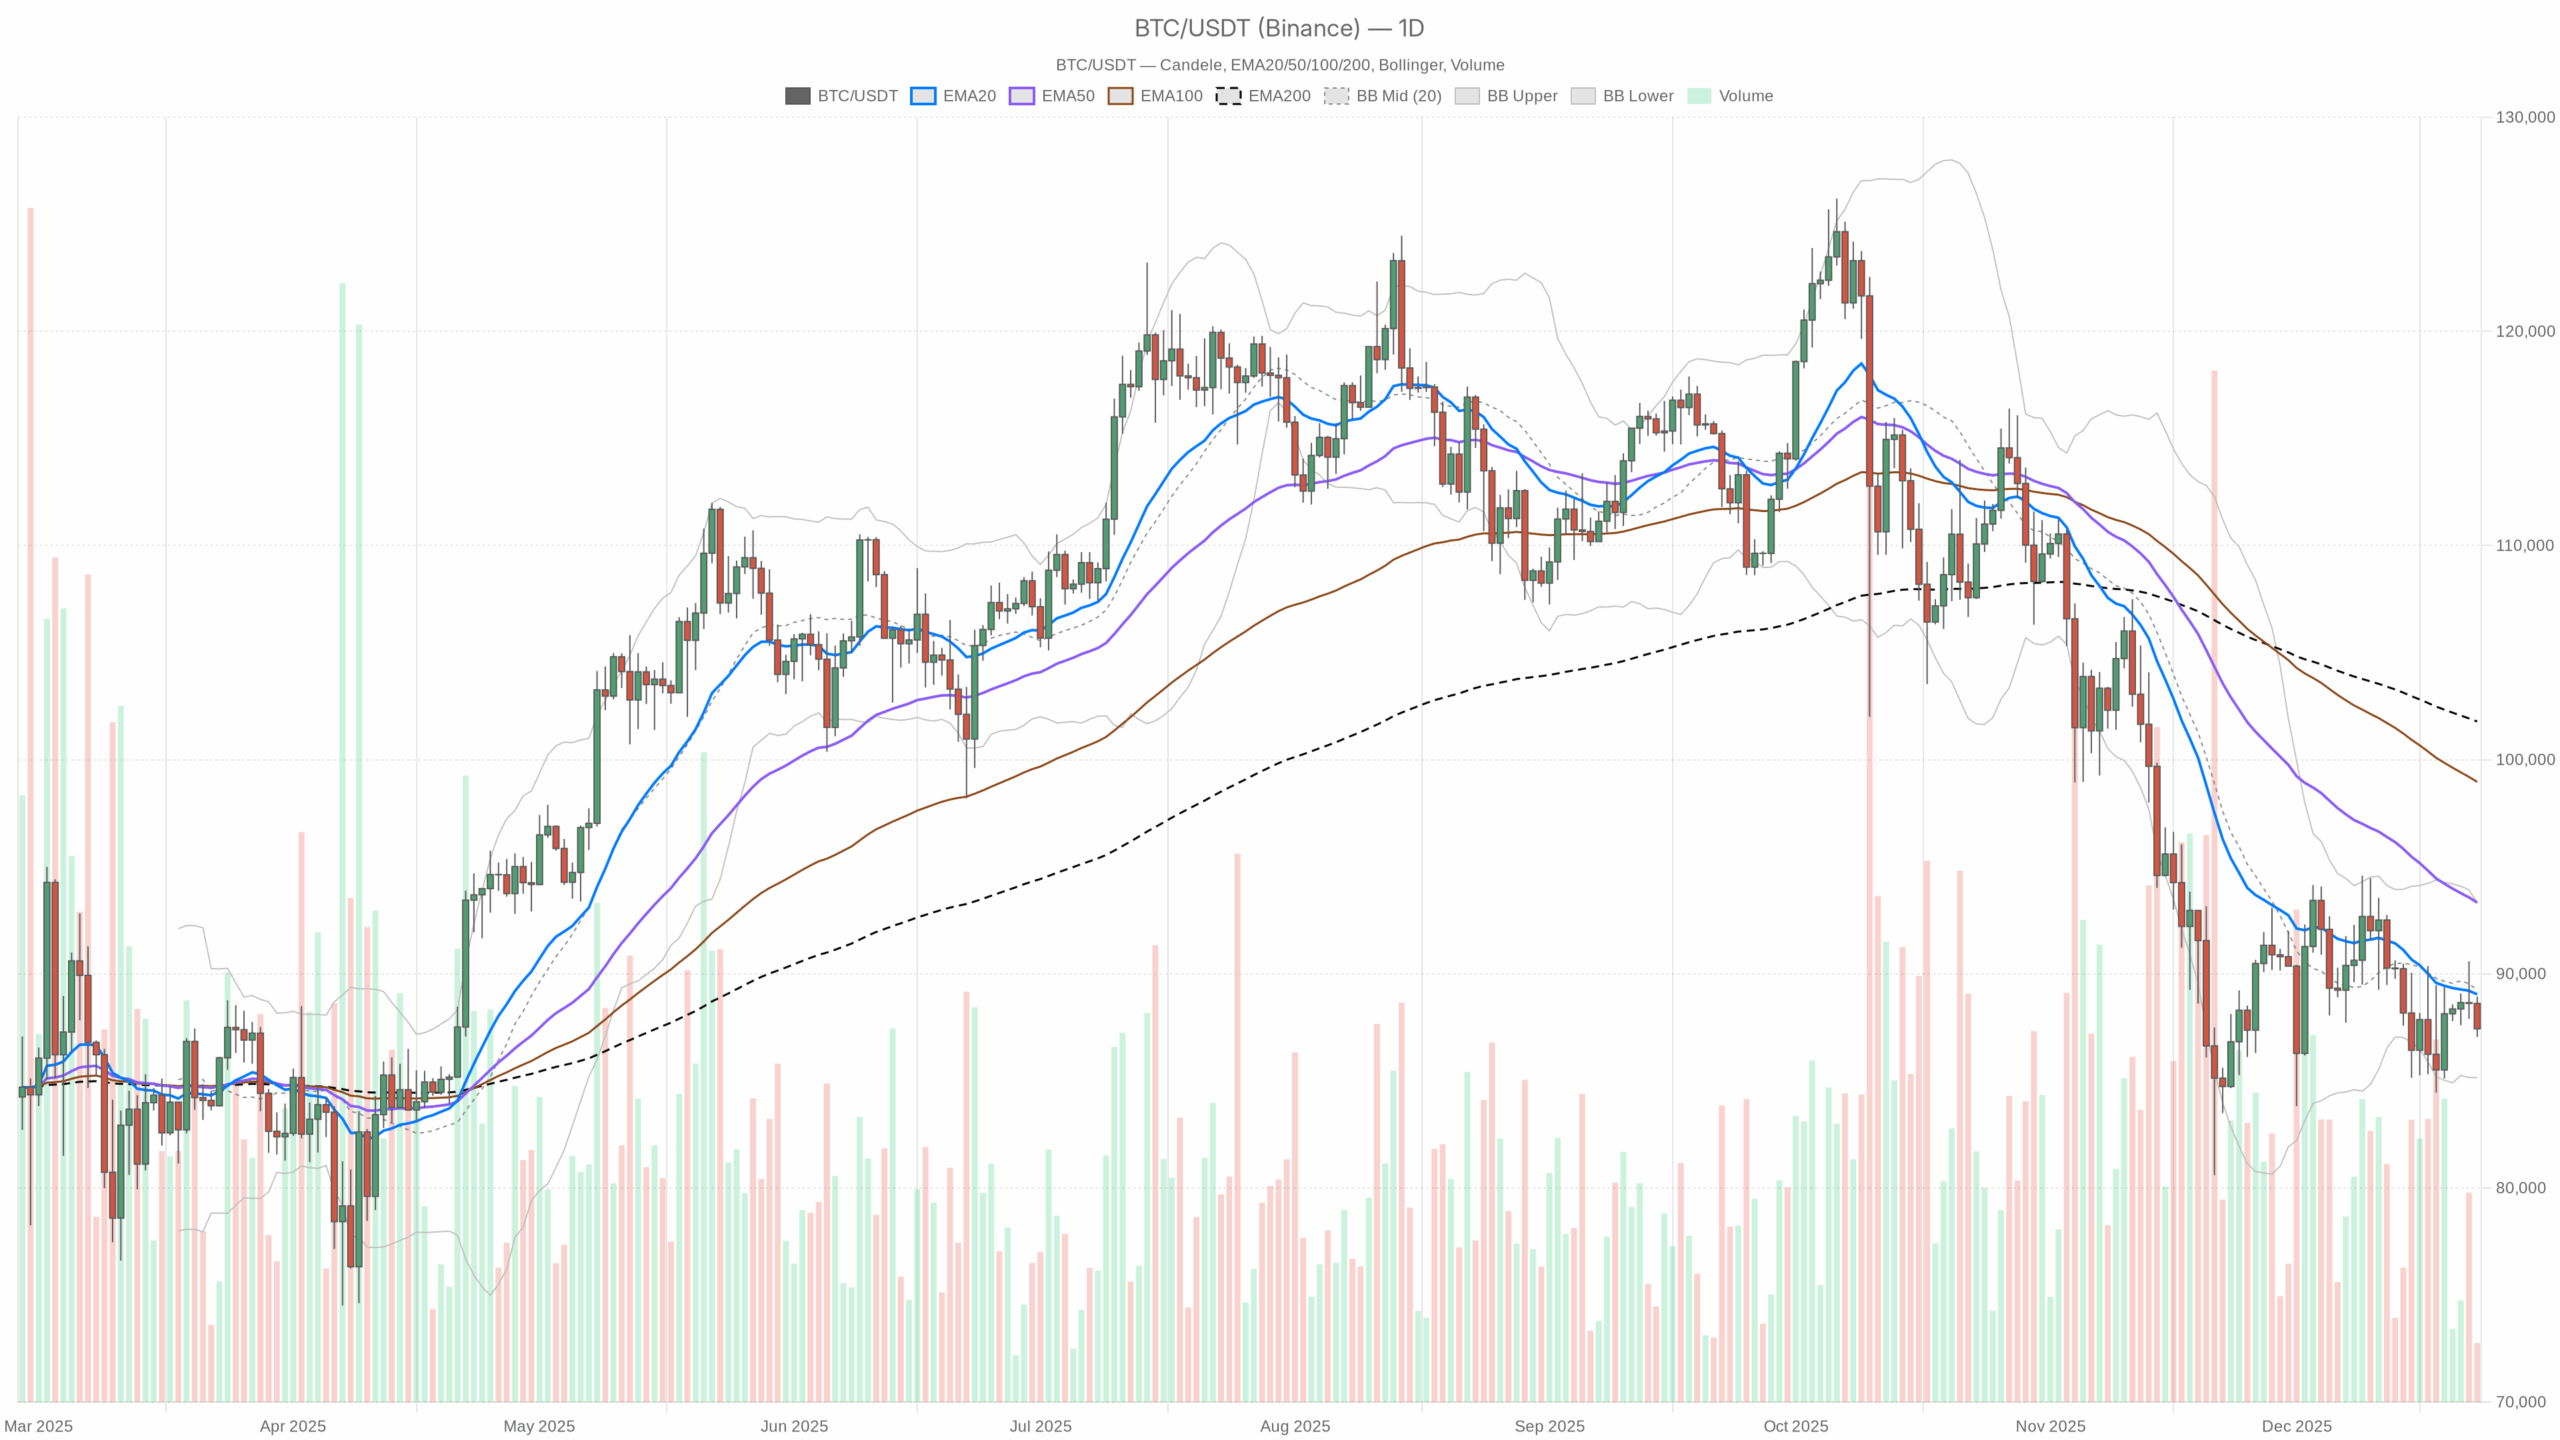 BTC/USDT — daily chart with candlesticks, EMA20/EMA50 and volume.
Daily Chart (D1): Primary Bias – Bearish, With Room for a Bounce
The daily timeframe drives the main thesis here: Bitcoin value is in a bearish regime with price trading under all major EMAs and stuck in the lower half of its Bollinger Band range. The question is not “is the trend down?” — it is. The real question is whether sellers are getting tired enough to let a bounce develop.
Trend Structure – EMAs
- Price (close): $87,433.99
- EMA 20: $89,042.35
- EMA 50: $93,328.00
- EMA 200: $101,785.65
Bitcoin is trading below the 20, 50 and 200 EMAs, with a clear downside stacking (price < EMA20 < EMA50 < EMA200). That is classic downtrend structure: rallies back into the $89k–$93k zone are, by default, potential sell-the-rip areas until proven otherwise. The fact that the 200 EMA is way up near $102k underlines how much long-term momentum has already rolled over, so we are no longer just in a shallow dip.
Momentum – RSI
- RSI 14 (D1): 42.7
Daily RSI is below 50 but still above classic oversold territory. Momentum is negative but not yet washed out. That means the market is weak, yet has not hit the kind of panic extreme that often triggers aggressive short-covering. There is room for both another leg down and a bounce, which keeps risk/reward tricky for late shorts.
Momentum – MACD
- MACD line: -1,413.60
- Signal: -1,620.15
- Histogram: +206.55
MACD is deep in negative territory but the line is now above the signal with a positive histogram. That usually marks a slowing of downside momentum rather than a clean trend shift. Sellers are still in control on the bigger picture, but the punch of the down-move is fading a bit. It is the kind of setup where you can get a countertrend bounce inside a broader downtrend.
Volatility and Range – Bollinger Bands & ATR
- Bollinger mid: $89,241.46
- Bollinger upper: $93,325.09
- Bollinger lower: $85,157.84
- ATR 14 (D1): $3,090.38
Price is sitting between the mid and lower band, leaning toward the lower side but not hugging it. That points to pressure downwards but without the kind of full-band ride you see in a trend climax. ATR at around $3k says daily volatility is still significant, so 3–4% swings in a day are entirely normal here. This environment punishes tight stops and late entries in both directions.
Key Daily Levels – Pivots for Bitcoin value
- Pivot point (PP): $87,808.50
- Resistance 1 (R1): $88,565.49
- Support 1 (S1): $86,677.01
Price is marginally below the daily pivot, with the nearest support band around $86,700 (S1) and first resistance in the high-$88k region. Staying pinned below the pivot keeps intraday control with sellers; reclaiming and holding above it would be the first sign that buyers are finally willing to defend higher levels.
Hourly Chart (H1): Selling Has Slowed, Downtrend Still Intact
The 1H regime is marked as neutral, which tells you the ferocity of the recent selloff has cooled, but you do not yet have a strong bullish countertrend. Think of it as a pause inside a downtrend rather than a floor.
Trend Structure – EMAs
- Price (close): $87,430.52
- EMA 20: $88,230.33
- EMA 50: $88,456.90
- EMA 200: $88,446.92
On the hourly, price is sitting roughly $800–1,000 below a tight EMA cluster around $88.2k–$88.5k. When all the EMAs converge like that above price, it usually acts as a short-term ceiling: intraday bounces into that band often meet supply. Until Bitcoin is trading and holding back above this cluster, the hourly chart is more about fading bounces than chasing upside.
Momentum – RSI
- RSI 14 (H1): 33.06
Hourly RSI is weak and just above oversold. It reflects persistent selling pressure, but also shows that we are not in freefall. There is scope for an oversold bounce, yet momentum is not strong enough to argue for a sustained intraday uptrend on its own.
Momentum – MACD
- MACD line: -393.57
- Signal: -253.33
- Histogram: -140.24
The MACD line is below the signal and firmly negative. On the hourly, that aligns with the idea of a controlled downtrend, with no panic but sellers retaining the upper hand whenever price approaches resistance. Any attempt to flip hourly structure bullish would need this MACD to start curling higher and cross back above the signal.
Range & Volatility – Bollinger Bands & ATR
- Bollinger mid: $88,453.06
- Bollinger upper: $90,001.44
- Bollinger lower: $86,904.67
- ATR 14 (H1): $460.57
Price is hovering near the lower band with an ATR of about $460, so each hourly candle routinely swings around 0.5%. That mix often breeds short-lived mean reversion: quick moves to the band edges followed by snapbacks to the middle, but within a broader downward drift. It is choppy enough that chasing breakdowns near the band lows is risky without a higher-timeframe trigger.
Hourly Pivots
- Pivot point (PP): $87,479.59
- R1: $87,581.69
- S1: $87,328.41
Intraday, Bitcoin is trading just under its hourly pivot with a very compressed support and resistance structure. This is a tight decision zone: break below around $87,300 on volume and you risk another mini-leg lower; hold above and push through $87,600+ and you open space for a retest of the EMA cluster near $88.5k.
15-Minute Chart (M15) for Bitcoin value: For Execution, Not Direction
The 15-minute chart is firmly bearish, but that is more about trade timing than big-picture direction. It tells you how aggressive the very short-term flow is.
Short-Term Trend – EMAs
- Price (close): $87,420.01
- EMA 20: $87,650.95
- EMA 50: $88,044.61
- EMA 200: $88,530.24
On M15, price is basically stair-stepping below a downward-sloping EMA stack. Every attempt to push higher runs into progressively lower moving average resistance. This is classic intraday downtrend behavior, suited more to tactical short entries on bounces than to blind dip buying.
Momentum – RSI
- RSI 14 (M15): 36.65
RSI on the 15-minute is weak but not extreme. Short sellers are in control at this granularity, but they are not yet at the kind of exhaustion extremes where you would expect a violent squeeze. For intraday traders, that supports the notion of grinding downside with intermittent, fadeable bounces.
Momentum – MACD
- MACD line: -190.42
- Signal: -214.38
- Histogram: +23.96
The MACD line is still negative, but it is starting to hook up above the signal, giving a small positive histogram. That is early evidence of downside momentum slowing on the shortest timeframe. It is more a warning for intraday shorts to avoid overconfidence than a green light for a full bullish reversal.
Range – Bollinger Bands & ATR
- Bollinger mid: $87,584.79
- Bollinger upper: $87,988.57
- Bollinger lower: $87,181.01
- ATR 14 (M15): $194.18
Trading is compressed inside a roughly $800 band, with each 15-minute candle typically swinging around $200. That is a noisy pocket: enough movement for scalpers, but not yet a structured breakout or breakdown. Position traders should treat these moves as noise around the higher-timeframe bias, not as stand-alone signals.
Short-Term Pivots
- Pivot point (PP): $87,428.41
- R1: $87,436.82
- S1: $87,411.60
Price is sitting almost directly on the 15-minute pivot. That reinforces the idea of a local balance zone where neither side has secured a clean intraday advantage. A decisive break and hold above R1 on rising volume would favor a push to the hourly EMA area; a slip under S1 that sticks would suggest sellers are reasserting themselves.
Market Context: Fear, Dominance, and Liquidity
The broader environment supports the technical picture and keeps the focus on risk conditions.
- Bitcoin dominance: 57.3%
- Total crypto market cap: $3.04T (down about 2.3% in 24h)
- Fear & Greed Index: 24 – Extreme Fear
Extreme fear with high BTC dominance and falling total market cap is textbook “defensive crypto” mode. Capital is either sitting in BTC, stables, or off-exchange; altcoins are structurally weaker; and macro buyers are cautious. The recent Bloomberg headlines calling out a potential fourth annual loss and dwindling volumes underline that we are in a phase of Bitcoin fatigue, where rallies struggle to find sustained spot demand.
Core Scenarios for Bitcoin Value
Bullish Scenario: Oversold Rally Within a Downtrend
For the bullish side, the play here is not new all-time highs now but rather a relief rally inside a larger bearish structure.
What the bulls need to see:
- On D1, Bitcoin value holds above or near the lower Bollinger Band around $85k without a harsh breakdown.
- Hourly price reclaims and holds above the EMA cluster at $88.2k–$88.5k, turning that zone from resistance into support.
- RSI on H1 and M15 pushes back above 50 and stays there, showing that bounces are being followed through, not sold immediately.
- MACD on H1 crosses back up toward the signal with the histogram flipping positive, confirming that sellers are finally losing control.
If that sequence plays out, a reasonable upside path is a mean-reversion leg into the daily Bollinger mid and EMA20 region around $89k–$90k, with stretch targets toward the upper band and EMA50 near $93k. That would still be a countertrend move, but enough to reset indicators and trap late shorts.
What invalidates the bullish scenario:
- A decisive daily close below the lower Bollinger Band (around $85k) accompanied by expanding ATR and heavy volume, signaling acceleration of the downtrend rather than exhaustion.
- Failure to reclaim the hourly EMA cluster, with every push into $88k–$89k being aggressively sold and followed by fresh lows.
If those bearish confirmations show up, the idea of a simple oversold bounce loses credibility, and bulls have to step aside from the short- to medium-term narrative.
Bearish Scenario for Bitcoin value: Trend Continuation and Value Compression
The bearish main case is straightforward: the current move is part of a broader downtrend in Bitcoin value, driven by fatigued spot demand and a risk-off macro tone.
What supports the bearish case right now:
- Daily regime flagged as bearish, with price under all major EMAs and under the daily pivot.
- RSI on all timeframes below 50, showing that downside momentum still dominates.
- MACD on D1 negative, and H1 MACD still firmly below the signal.
- Extreme fear and weak global market cap, reinforced by mainstream narratives about Bitcoin stagnation.
In this scenario, rallies into the $88k–$90k area are sold, hourly EMAs keep capping price, and we eventually see a clean break below $86k and then the lower daily band around $85k. From there, volatility likely expands, ATR moves higher, and the market starts searching for a new equilibrium lower, with deeper support levels being tested as buyers step back.
What would invalidate the bearish scenario:
- A sustained reclaim of the daily EMA20 (around $89k) with multiple daily closes back above it.
- Daily RSI turning up through 50 and holding, indicating a genuine momentum shift rather than just short-covering.
- Hourly and 15-minute structures flipping to higher highs and higher lows while BTC continues to trade above the hourly EMA cluster.
If those conditions take shape, the market would be signaling that the downtrend is at least pausing in favor of a broader consolidation, and the bearish continuation thesis would need to be toned down.
Positioning, Risk and Uncertainty
From a positioning standpoint, this is a market where trend and mean reversion are in direct tension. The daily chart says respect the downtrend, but the intraday data shows early signs of sellers tiring. That is exactly the type of environment where chasing either extreme, panic selling after a big leg down or impulsive bottom-fishing, can backfire quickly.
Volatility remains elevated across timeframes, with ATR on D1 near $3k and H1 near $460. That means Bitcoin value can move thousands of dollars in very short periods. Any strategy that does not explicitly account for that volatility, in terms of position sizing and risk limits, is effectively betting on being lucky with timing.
In practical terms, traders need to be clear on their timeframe. The daily bias is still bearish until price recaptures the EMA20 and the mid-Bollinger band. Intraday, there may be tactical long opportunities if the hourly EMA cluster is reclaimed, but those would be countertrend trades and need tight scenario planning. For anyone focused on higher timeframes, the key is waiting for either a proper capitulation leg with oversold extremes or a clear structural bottom with rising demand, rather than assuming the current level must be fair value.
Uncertainty stays high as long as macro risk appetite is low and liquidity is patchy. Bitcoin can pivot quickly if larger participants decide current levels are attractive, but until the charts actually show that shift, the burden of proof is on the bulls.
Open your Investing.com account
This section contains a sponsored affiliate link. We may earn a commission at no additional cost to you.
Disclaimer: This analysis is for informational and educational purposes only and reflects a personal market view at a specific point in time. It is not investment, trading, or financial advice, and it should not be the sole basis for any trading decisions. Bitcoin and other cryptocurrencies are highly volatile and involve substantial risk, including the risk of total loss. Always conduct your own research and consider your risk tolerance before engaging with these markets.


You May Also Like

Bitcoin Eyes 3% May Dip as US PMI Data Could Lift BTC

The Next Crypto Breakout Below $1 Investors Are Preparing For

Ripple Unlocks 400 Million XRP: What It Means for the Market


