

Aster price analysis: bears in control, but sellers look tired

The market is grinding lower, with Aster price hugging support as broader crypto sentiment remains defensive and volatility compressed across key timeframes.
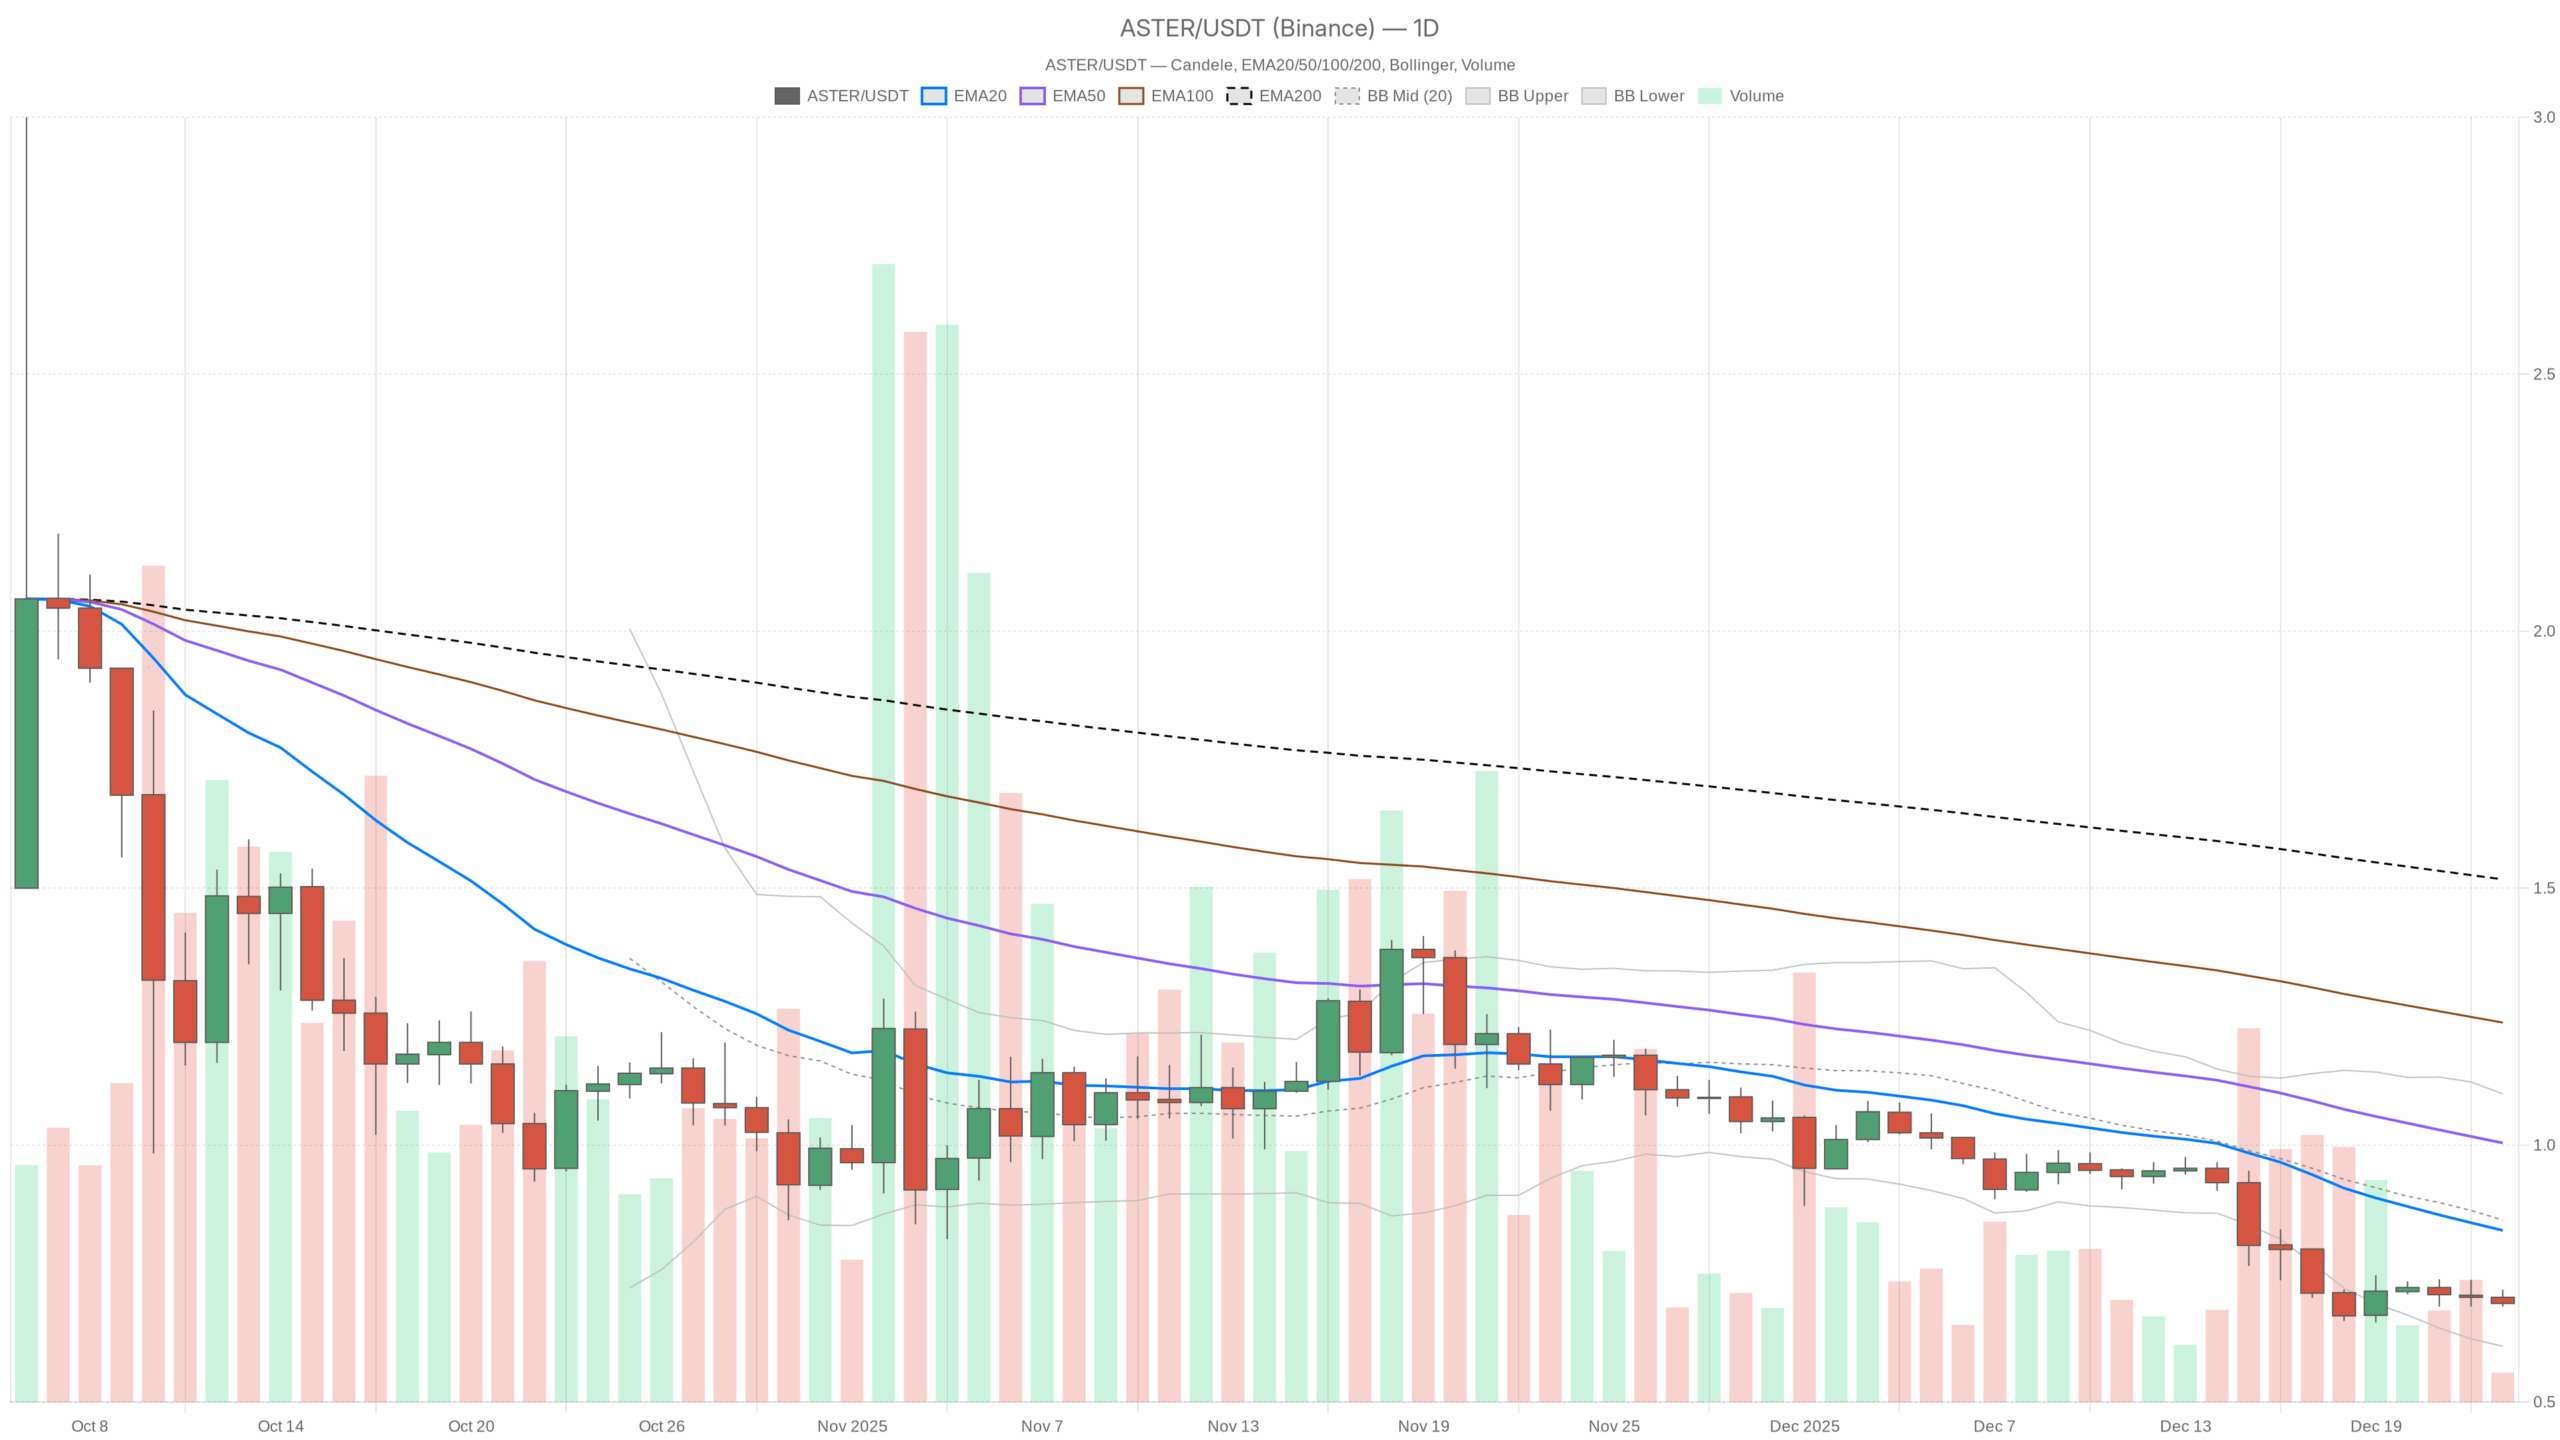 ASTER/USDT — daily chart with candlesticks, EMA20/EMA50 and volume.
Daily trend (D1) for Aster price: clear downtrend, flirting with oversold
EMA structure
On the daily, Aster price trades at $0.69 with:
- EMA 20: $0.83
- EMA 50: $1.00
- EMA 200: $1.52
Price is well below all three EMAs, and they are stacked bearishly (20 < 50 < 200) with a bearish regime flag. That is a textbook downtrend: rallies into the 20-day EMA (~$0.83) are likely to be sold, and the longer-term trend only turns constructive again once price can reclaim and hold above the 50-day (~$1.00).
In plain terms: the path of least resistance is still down, and any bounce is guilty until proven otherwise while price is stuck under $0.83–1.00.
RSI (14)
RSI 14 (D1): 29.96
Daily RSI has just slipped under 30, effectively in oversold territory.
This means the selloff is stretched in the short term. It does not guarantee a bottom, but it warns that fresh shorts are late and the risk of a snap-back rally is growing if sellers cannot push price much lower from here.
MACD
MACD line: -0.10, Signal: -0.09, Histogram: -0.01
MACD is negative, confirming the prevailing downtrend, but the histogram is only slightly below zero.
Downside momentum is still there, but not accelerating. Bears are in control, but they are no longer hitting the gas; they are just keeping pressure on. That aligns with a market that can grind lower, but is vulnerable to short-covering bounces.
Bollinger Bands
BB mid: $0.85, Upper: $1.10, Lower: $0.61
Price: $0.69, near the lower band
Aster trades in the lower part of the band range, not pinned to the absolute edge but clearly in the lower volatility pocket.
This signals a controlled downtrend rather than a waterfall: sellers are walking price down, not capitulating. As long as price hugs the lower band, the trend stays intact. A move back toward the mid-band around $0.85 would be a sign of mean reversion kicking in.
ATR (14)
ATR 14 (D1): $0.06
Daily ATR at six cents with price at $0.69 indicates moderate volatility. It is not dead, but it is nowhere near a blow-off move.
Right now the market is bleeding rather than crashing. That means risk is skewed toward slow grind losses and surprise spikes in either direction if liquidity thins.
Daily pivots
Classic daily pivot levels:
- Pivot Point (PP): $0.70
- Resistance 1 (R1): $0.71
- Support 1 (S1): $0.68
Price at $0.69 sits just below the daily pivot and just above S1.
Intraday, this is a classic balance zone: dip buyers defend around $0.68, while short-term sellers lean on the $0.70–0.71 area. A clean break of either side is likely to dictate the next short leg.
Hourly context (H1): bear trend, but downside momentum cooling
EMA structure
On the 1-hour chart:
- Price: $0.69
- EMA 20: $0.70
- EMA 50: $0.71
- EMA 200: $0.75
Price is marginally below the 20 and 50 EMAs, and well under the 200 EMA, with the regime still marked bearish.
Short term, the market is in a gentle downtrend, but it is not a steep slide. Hourly bounces into $0.70–0.71 are the first regions where intraday sellers are likely to show up, while a push toward $0.75 would be the more serious test of the downtrend.
RSI (14)
RSI 14 (H1): 41.02
Hourly RSI sits below 50 but comfortably above oversold.
Bears still have the upper hand intraday, but the immediate pressure is not extreme. Selling is more methodical than emotional here.
MACD
MACD line: 0.00, Signal: 0.00, Histogram: 0.00
Flat MACD around zero on the hourly is basically a “no strong impulse” print.
Momentum is pausing: the market is deciding whether $0.69 becomes a base for a bounce or just a staging area for another leg lower.
Bollinger Bands
BB mid: $0.70, Upper: $0.72, Lower: $0.69
Price is sitting right on top of the lower band, with a very tight band width.
The tape is compressed and slightly leaning bearish. Tight bands often precede a volatility pop; with the broader trend down, the default continuation is lower unless buyers can reclaim the mid-band near $0.70.
ATR (14)
ATR 14 (H1): $0.01
Hourly volatility is low, with average candles swinging around a cent.
Liquidity pockets can cause outsized slippage relative to current ATR when a move finally expands out of this tight range.
Hourly pivots
On H1, the pivot table compresses:
- PP: $0.69
- R1: $0.69
- S1: $0.69
Everything clusters at the same price, reflecting the very narrow range.
This is classic consolidation: the market is marking time around $0.69 with neither side committing heavily, waiting for the next catalyst.
15-minute (M15): execution zone, micro-consolidation
EMA structure
On M15:
- Price: $0.69
- EMA 20: $0.70
- EMA 50: $0.70
- EMA 200: $0.71
Price sits just under a tight EMA cluster with a bearish regime flag.
Very short term, this is a sideways-to-down drift. Any push above $0.70 that holds on 15-minute closes would be the first hint that buyers are trying to regain some control intraday.
RSI (14)
RSI 14 (M15): 39.28
RSI is below 50, but not oversold.
Micro structure skews bearish, but without panic. Scalpers are leaning short on pops rather than chasing lows.
MACD
MACD line: 0.00, Signal: 0.00, Histogram: 0.00
MACD at zero again signals a lack of clear impulse on this timeframe.
The market is waiting; there is no strong push from either side on the smallest timeframe we are watching.
Bollinger Bands & ATR
BB mid: $0.70, Upper: $0.70, Lower: $0.69
ATR 14 (M15): ~0.00
Bands are extremely tight and ATR is effectively flat.
This is a volatility coil. On its own it does not tell you direction, but in a broader downtrend it usually breaks lower unless there is a strong catalyst to the upside.
Putting it together: main bearish scenario with a bounce risk
Across timeframes, the message is consistent: the dominant trend for ASTER/USDT is bearish. Daily and hourly EMAs all slope down with price trading underneath, the regime is marked bearish on all three timeframes, and the broader crypto market is in risk-off mode with high BTC dominance and extreme fear.
The nuance is on momentum: daily RSI is oversold and MACD’s downside push is no longer accelerating. Hourly and 15-minute charts show compressing volatility and flat MACD. In other words, the downtrend is intact, but the most aggressive phase of selling may be pausing here.
Bullish scenario for Aster price
A constructive path from here would look like this:
- Price defends the $0.68 S1 support on the daily and stops closing new lows.
- 15-minute and hourly charts break and hold above $0.70–0.71, dragging price through the short-term EMAs.
- Daily RSI climbs back above 30–35, showing that selling pressure is genuinely easing rather than just pausing.
- A first upside target in that case would be the daily Bollinger mid-band and 20-day EMA around $0.83–0.85. In a stronger squeeze, price can stretch toward the psychological $1 level, where the 50-day EMA currently sits.
What would invalidate the bullish scenario?
A clean break and daily close below $0.68 that pushes RSI deeper into the 20s would undercut the bounce thesis and argue that the downtrend is simply extending, likely in step with broader altcoin weakness.
Bearish scenario for Aster price
The dominant scenario, given the current structure, is continued downside:
- Price fails to reclaim $0.70–0.71 and continues to respect the 20-day EMA (~$0.83) as strong dynamic resistance.
- Consolidation around $0.69–0.70 resolves lower, breaking $0.68 and walking down along the lower Bollinger Band toward $0.61, which is the current lower band level.
- Hourly RSI stays sub-50 on failed rallies, showing that every bounce is being sold rather than accumulated.
In this case, the market would be pricing in further risk-off across altcoins, with Aster continuing to underperform majors as capital concentrates into BTC, ETH, and stables.
What would invalidate the bearish scenario?
A decisive move back above the $0.83–0.85 area, with daily closes above the 20-day EMA and a sustained RSI recovery above 40, would signal that the downtrend is losing its grip. A pickup in ATR alongside higher prices would confirm that buyers are finally willing to chase rather than just fade dips.
Positioning, risk, and uncertainty for Aster price
From a trading standpoint, Aster price sits in a late-stage downtrend with short-term volatility compression. That combination is tricky: chasing shorts here exposes you to oversold squeezes, while blind dip-buying fights a still-valid bearish structure.
The key battle lines are straightforward:
- Short-term line in the sand: $0.68–0.71. This is today’s intraday range around the pivot and S1; a break and hold on either side is likely to bring a volatility expansion.
- Trend-defining resistance: $0.83–1.00. As long as price is below the 20- and 50-day EMAs, any bounce is technically a rally within a downtrend.
- Risk zone below: a sustained move under $0.68 opens the door to a test of the lower Bollinger band near $0.61, with rising odds of stop cascades if liquidity is thin.
Volatility is currently moderate on the daily and compressed intraday, which often precedes more violent moves when one side finally steps up. With the broader market in extreme fear, uncertainty is high: macro headlines or BTC swings can quickly override local technicals.
For anyone active on this pair, the technical message is clear: respect the prevailing downtrend on Aster price, but do not ignore the growing risk of a short-covering bounce from oversold levels. Define your invalidation levels tightly and size positions with the understanding that a quiet tape can become a fast market very quickly.
Open your Investing.com account
This section contains a sponsored affiliate link. We may earn a commission at no additional cost to you.
Disclaimer: This article is a market commentary and reflects a technical view on the Aster price at the time of writing. It is not investment advice, and it does not take into account your individual circumstances. Always do your own research and consider your risk tolerance before making any trading decisions.


You May Also Like

Planet Labs (PL) Stock: Plunges as Q1 Revenue Jumps 42% and AI Push Grows

Pi Network Completes Protocol 24 Upgrade, Sets June 18 Deadline for Next Migration

Flutterwave targets multi-rail stablecoin payments with Tempo partnership


