Macro Meets Crypto: Predicting Prices with CPI, Fed Rates & BTC Dominance
Institutional money has changed how crypto trades. Bitcoin and Ethereum now respond to economic news in ways that mirror traditional assets. Reports on the CPI, inflation, and interest rates move prices. This shift means macroeconomic indicators are no longer optional for crypto traders. They are part of the core playbook.
This article explains how official data on inflation, central bank rates, and crypto-specific indicators like Bitcoin dominance can help anticipate market trends. The analysis draws on macro releases, crypto charts, and research from large trading desks.
The goal is not to predict exact moves but to offer a practical guide to understanding how broader economic trends shape crypto performance.
Inflation and Bitcoin: CPI’s Growing Grip on Crypto
Inflation started rising sharply in early 2022. The Consumer Price Index, reported by the Bureau of Labor Statistics, reached nine percent year-over-year in June. Bitcoin fell six percent within three days of that release. Investors moved out of risk assets, expecting tighter financial conditions.
This pattern continued through 2023 and 2024. When CPI came in lower than forecasts, Bitcoin often rebounded. For example, in November 2022, the month-over-month print was 0.1 percent against a forecast of 0.3 percent. Bitcoin gained nearly four percent within two days.
This repeated reaction suggests Bitcoin now trades more like tech stocks. It does not act like a hedge against inflation in the short term. Instead, it follows interest rate expectations. If inflation readings push the Federal Reserve toward cuts, traders often rotate into crypto. If inflation jumps, traders exit fast.
CPI for May 2025 showed price growth slowing toward the Federal Reserve’s target. If that trend continues, investors may add risk again. However, if energy costs or wages lift inflation above forecasts, expectations may shift back toward tightening.
Traders will likely adjust positions in Bitcoin and Ethereum based on these releases. CPI releases now act as drivers of short-term price direction.
Fed Rates and Ethereum: Liquidity Cycles in Action
The Federal Reserve began raising interest rates in March 2022. That cycle lasted until mid-2023, with the target range reaching 5.25 to 5.5 percent. Each increase indicated tighter liquidity. Ethereum often fell in the days following these announcements, mirroring declines in growth-focused equities.
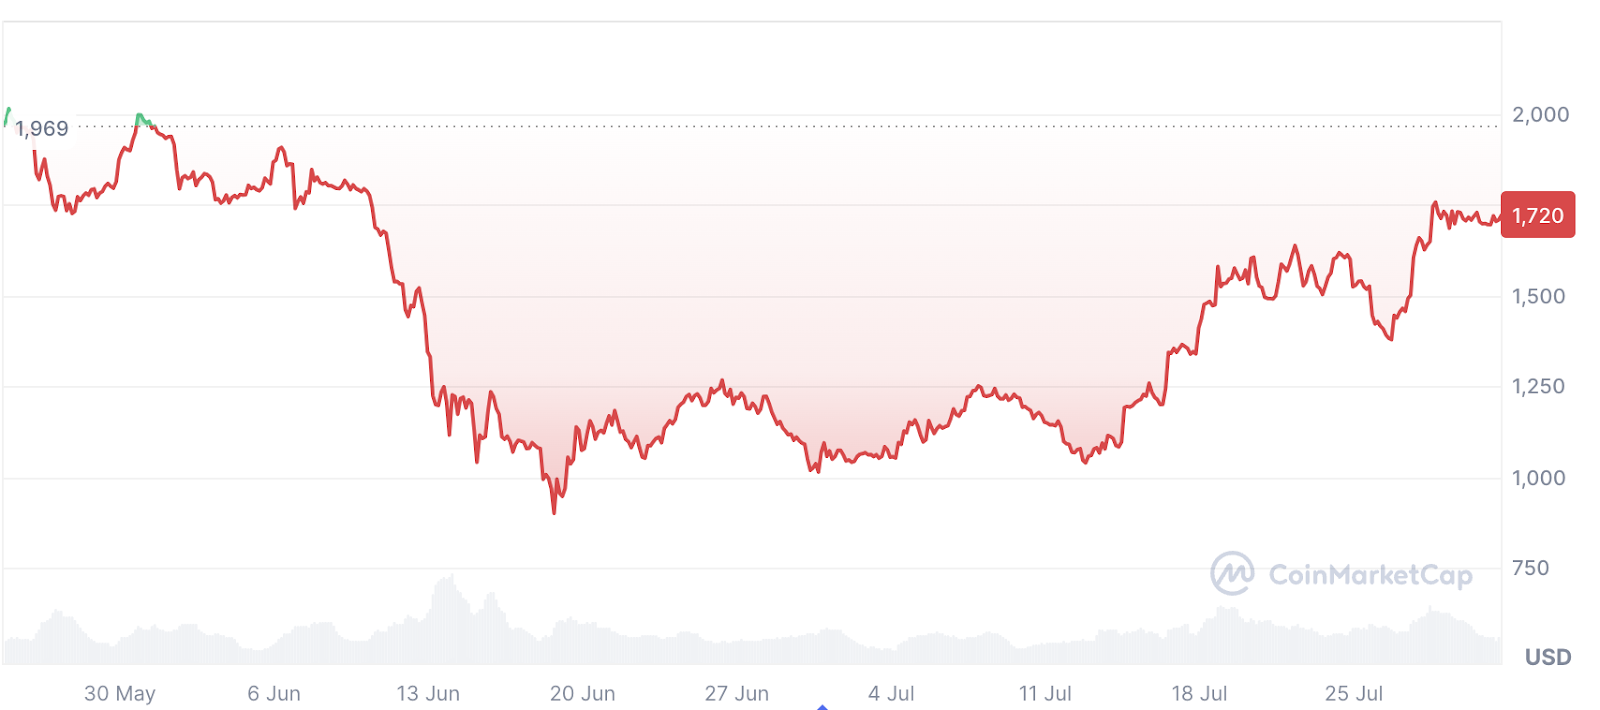
Ethereum Price 2022 (Source: CoinMarketCap)
Ethereum’s sensitivity to rate decisions became clear in several key moments. After the June 2022 hike of 75 basis points, ETH dropped by over eight percent within 48 hours. The same pattern repeated in September. By contrast, when the Fed paused in July 2023, ETH rebounded by nearly five percent over the next three trading sessions.
However, one exception came in March 2023. The collapse of Silicon Valley Bank triggered panic in financial markets. The Fed raised rates by 25 basis points but indicated it might stop soon. That shift helped ETH recover as it climbed from under $1,400 to over $1,800 within three weeks.
These events show Ethereum’s link to monetary policy. Rate hikes tighten conditions and push ETH down. Pauses or signs of easing often lead to sharp rebounds. Ethereum trades like a proxy for risk appetite in a liquidity-driven market.
Bitcoin Dominance: Crypto’s Own Macro Gauge
Bitcoin dominance tracks the percentage of total crypto market value held in Bitcoin. When dominance rises, it often reflects a retreat to safety. During periods of macro tightening, investors reduce exposure to smaller tokens and move capital into Bitcoin. This behavior mirrors broader risk-off patterns.

U.S. Interest Rate 2015-2025 (Federal Reserve Bank)
From late 2021 through 2022, Bitcoin dominance climbed from under 40 percent to nearly 48 percent. That move came during sharp inflation spikes, and a series of Fed rate increases as the market pulled back from speculative assets. Dominance rose again in mid-2023, just before the Fed indicated a pause, and fell shortly after.
This pattern supports a familiar cycle. In early risk-on phases, Bitcoin leads. Once it stabilizes, capital rotates into Ethereum, then into altcoins with lower market value. Drops in dominance often mark the beginning of these rotations. The index can act as a sign of changing sentiment within the market.
Bitcoin dominance reflects how crypto investors respond to broader economic shifts. It can function like a barometer—trending upward when uncertainty grows and falling when conditions favor higher risk exposure.
Institutional Macro Forecasts and the Next 90 Days
Institutional research over the past year has increasingly tied macro indicators to digital asset performance.
In an October 2024 report, Crypto.com Research stated: “Economic growth may generally indicate a more favourable environment for cryptocurrencies, but the impact will vary depending on other market conditions.” They noted that “increasing correlation between traditional markets and cryptocurrencies means that stock market performance may potentially provide valuable insights into potential crypto trends.”
Looking ahead, the next 90 days include several macro events that could affect crypto direction. The July CPI data is due on August 12, with consensus forecasting a YoY increase of 2.8 percent. The next FOMC meeting is on September 17, where markets currently price a 25 basis point cut. The August nonfarm payroll report (due September 6) and Q2 GDP revision (August 29) also stand out as volatility triggers.
These dates offer key decision points. A lower CPI print could reinforce Fed easing expectations and push capital into risk assets. On the other hand, a stronger-than-expected payroll may reduce those expectations. ETF-related flows and crypto-native reactions will likely hinge on these cues, reinforcing the case that macro indicators now drive the broader crypto narrative.
Conclusion: A Macro-Informed Strategy
Macroeconomic indicators now play a measurable role in shaping the crypto market direction. Inflation data, central bank policy, and internal metrics like Bitcoin dominance have shown clear relationships with past price shifts in both Bitcoin and Ethereum. These signs, when aligned, can offer a grounded framework for interpreting future moves.
While no model captures every turn, tracking CPI releases, FOMC decisions, and market reactions allows for more informed positioning. Macro data will not replace crypto-native analysis, but it adds a broader context that is becoming harder to ignore. Keeping an economic calendar in view may prove as useful as any technical chart.


You May Also Like

Why Cardano (ADA) Price Is Lagging While Other Altcoins Move — What Traders Are Missing

Utility vs Hype: Why BlockchainFX ($BFX) License Beats Blazpay (BLAZ) And IPO Genie (IPO) For The Best Crypto Presale To Buy In 2026