Solana (SOL) Faces Liquidation Risk as Traders Eye $120 and $130 Levels
Solana (SOL) is near an urgent inflection point as derivative indicators show packed liquidation areas on either side of the market’s present price region. Traders closely monitor the $120 level of support and the $126-$130 region of resistance, where breakouts could set off chain reactions of liquidations that would accelerate near-term volatility.
As market analyst Ted Pillows has revealed some key observations about the state of Solana’s market, the fact is that the asset is now boasting “decent long and short liquidation clusters”. This is a sign that the leverage is stacked in both directions to an extreme degree.
Liquidation Clusters Create a Volatile Setup
Liquidation heat maps show that leverage traders have placed themselves aggressively along the significant price levels. As soon as Solana approaches the price range of $126 to $130, a substantial number of sell positions could get liquidated, contributing to an explosive rise in the price.
On the other side, breaking down below $120 could be just as destructive. The long positions are packed closely just below the support areas, which means that a breakdown can lead to massive liquidations, thereby causing the price to move lower in a short period of time.
This two-sided risk is a reflection of a market being very susceptible to changes in momentum, where a small price change creates a huge impact.
Also Read: Solana (SOL) Could Surge to $308 as Ondo Finance Brings Stocks and ETFs to Solana
Derivatives Dominance Signals Speculative Pressure
The current arrangement draws attention to the ever-rising role of derivatives markets in determining Solana prices. High leverage and large position sizes tend to result in sharp moves, particularly when spot market demand does not manage to support adequately.
Contrary to when it is an organic buying or selling situation, price action in such markets is often driven by liquidation activities. This means that Solana’s immediate price action may not be driven by fundamentals, but by which side of the market is compelled to liquidate first.
Key Levels Traders Are Watching
The $120 level has proven itself as a strong psychological and technical support. Remaining above this level could preserve long positions and make another attempt at breaking through higher levels of resistance.
On the other side, a major source of liquidity can be found around $126 to $130. A test of these levels could result in some short squeezes before sellers regain control.
Until one of these ranges is broken out, SOL is expected to trade sideways while experiencing heightened intraday volatility.
Also Read: Solana and Ethereum Poised to Explode as Tokenization Accelerates


You May Also Like
USD/JPY Stalls: Critical US Jobs Report Looms as Intervention Fears Intensify
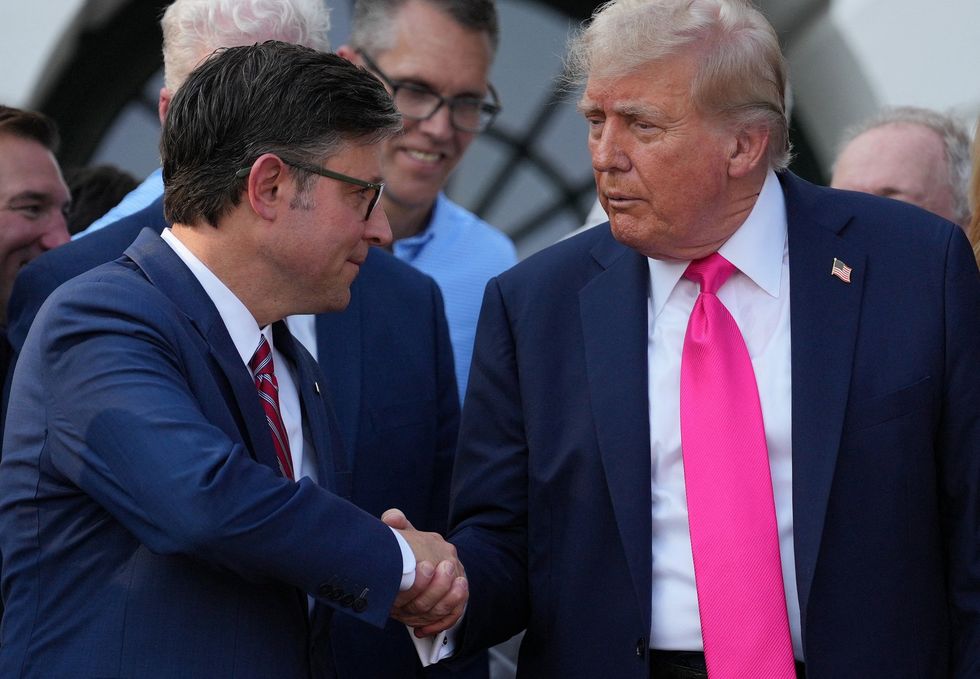
Top Washington power players already planning for GOP’s midterm demise