

SUI vs SEI: Which Altcoin Is Holding Structure Better Going Into 2026?

The post SUI vs SEI: Which Altcoin Is Holding Structure Better Going Into 2026? appeared first on Coinpedia Fintech News
As the markets are approaching the end of 2025, the consolidation seems to have overpowered the volatility among the cryptos. Bitcoin price silently climbed above $90,000, and Ethereum price rose above $3,000. Unfortunately, both levels were lost as bears teamed up, dragging them below the psychological barrier. This suggests the capital remains concentrated in the large caps, and until this trend persists, altcoins may continue to face pressure. In times when altcoins are losing ground and long-term structures, prices of SUI and SEI are offering a useful comparison.
SUI Price Prediction 2026: Base Formation After a Deep Correction
The Sui price has shifted from a sharp downtrend into a base-building phase on the daily chart. After a steep sell-off from the highs, the price has stabilized inside a well-defined demand zone near the $1.30–$1.40 region, where buyers have stepped in multiple times. The structure now resembles a rounded base/accumulation pattern, with downside momentum clearly slowing.
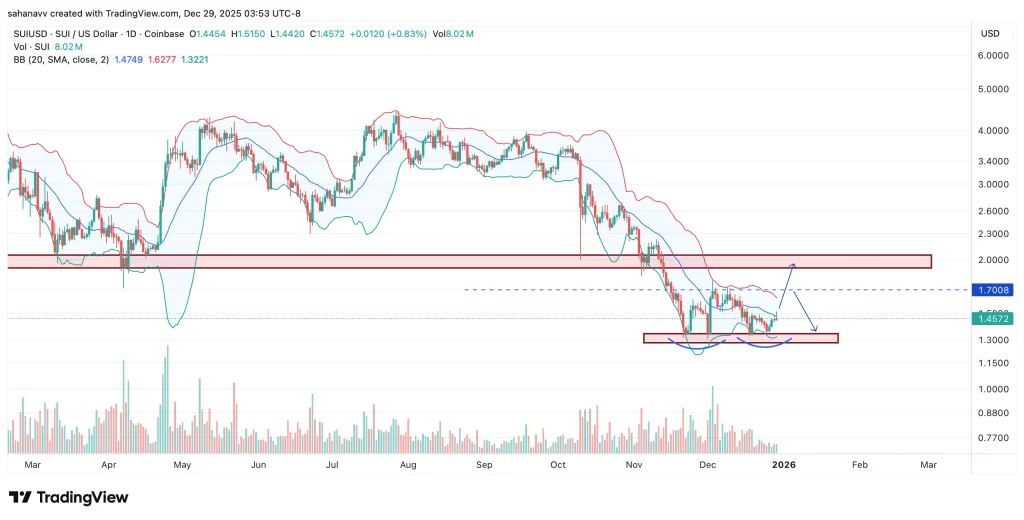
Price is trading below key moving averages, but the Bollinger Bands have begun to contract, signaling reduced volatility. This suggests selling pressure is getting absorbed rather than accelerating. As long as SUI holds above the demand zone, the structure favors consolidation with the potential for a recovery move toward $1.70–$2.00, where prior supply sits. A clean breakdown below the base would invalidate this setup.
SEI Price Prediction 2026: Downtrend Channel Still Intact
In contrast, the SEI price remains locked inside a clear descending channel on the daily timeframe. Sei price continues to post lower highs and lower lows, confirming that the broader downtrend has not yet ended. Each bounce has been capped by the channel’s upper boundary, reinforcing persistent seller control.
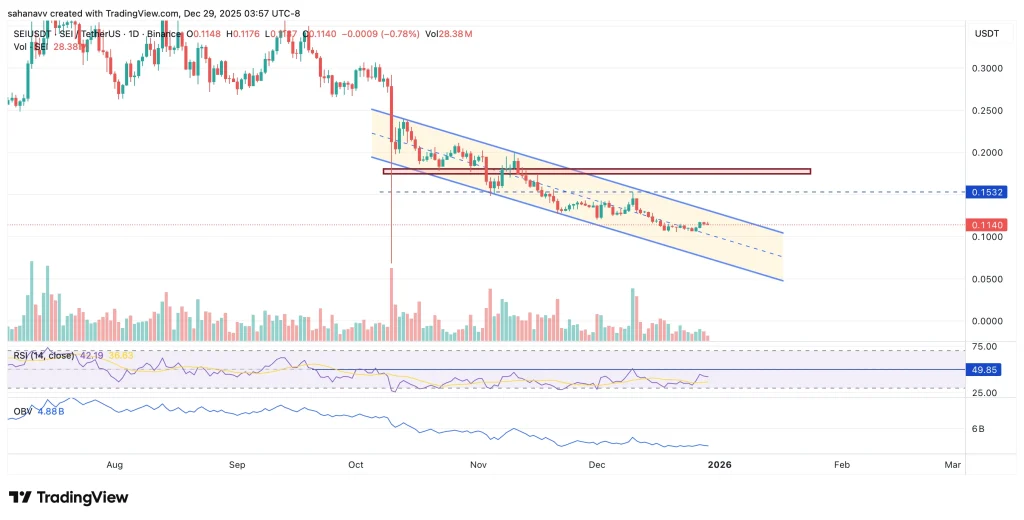
Momentum indicators reflect this weakness. RSI is struggling to hold above the midline, while OBV remains flat to declining, showing a lack of strong accumulation. Although SEI is hovering near a support zone around $0.11–$0.12, this level has not yet produced a meaningful structural reversal. For SEI to shift bullish, it must break above the descending channel and reclaim the $0.15–$0.18 resistance zone. Until then, rallies remain corrective rather than trend-changing.
- Also Read :
- US Market Events This Week: Why Bitcoin and Ethereum Traders Should Stay Cautious
- ,
Market Context: Why Structure Matters Right Now
When comparing both setups side by side, the difference in risk profile becomes clear. SUI price is showing relative strength, with smaller drawdowns and a cleaner base formation. SEI, on the other hand, offers higher upside potential due to the depth of its correction, but that upside remains conditional on a structural trend shift.
With Bitcoin and Ethereum still dictating overall market direction, large-scale liquidity rotation into altcoins has yet to fully materialise. In such conditions, altcoins with weak charts often continue to lag, while those showing accumulation and higher lows are better positioned once momentum returns. This environment favours patience and structure over speculation.
Conclusion: Two Different Bets for 2026
SUI and SEI represent two very different technical profiles heading into 2026. SUI is consolidating above key support, maintaining higher lows and signaling strength through stability. As long as it holds its demand zone, the downside risk appears limited relative to the broader altcoin market.
SEI, meanwhile, remains a higher-risk, higher-reward setup. Its proximity to long-term support offers upside potential, but only a confirmed break above the descending trendline would shift the bias decisively bullish. Until then, SEI remains trend-dependent, while SUI stands out as the structurally safer hold in the current market phase.
FAQs
If Bitcoin continues to absorb most market liquidity, smaller altcoins may struggle to attract sustained inflows. This often delays trend reversals and forces weaker projects to revisit or retest long-term support levels.
Short- to medium-term traders are more exposed to downside risk in structurally weak charts, while long-term investors may prioritize assets showing accumulation. Portfolio managers also adjust allocations based on relative strength.
Failure to reclaim key resistance could lead to extended consolidation or further downside, reducing market confidence. This may limit new capital inflows until a clear structural change occurs.


You May Also Like

Why Businesses Need Professional Machine Design and Development Services

Why Rocket Lab stock tumbled on Nasdaq-100 news

Attacker Drains $2.1 Million From Deprecated Aztec Connect Contracts in Ethereum Exploit


