

Bitcoin price forms alarming patterns ahead of the FOMC minutes
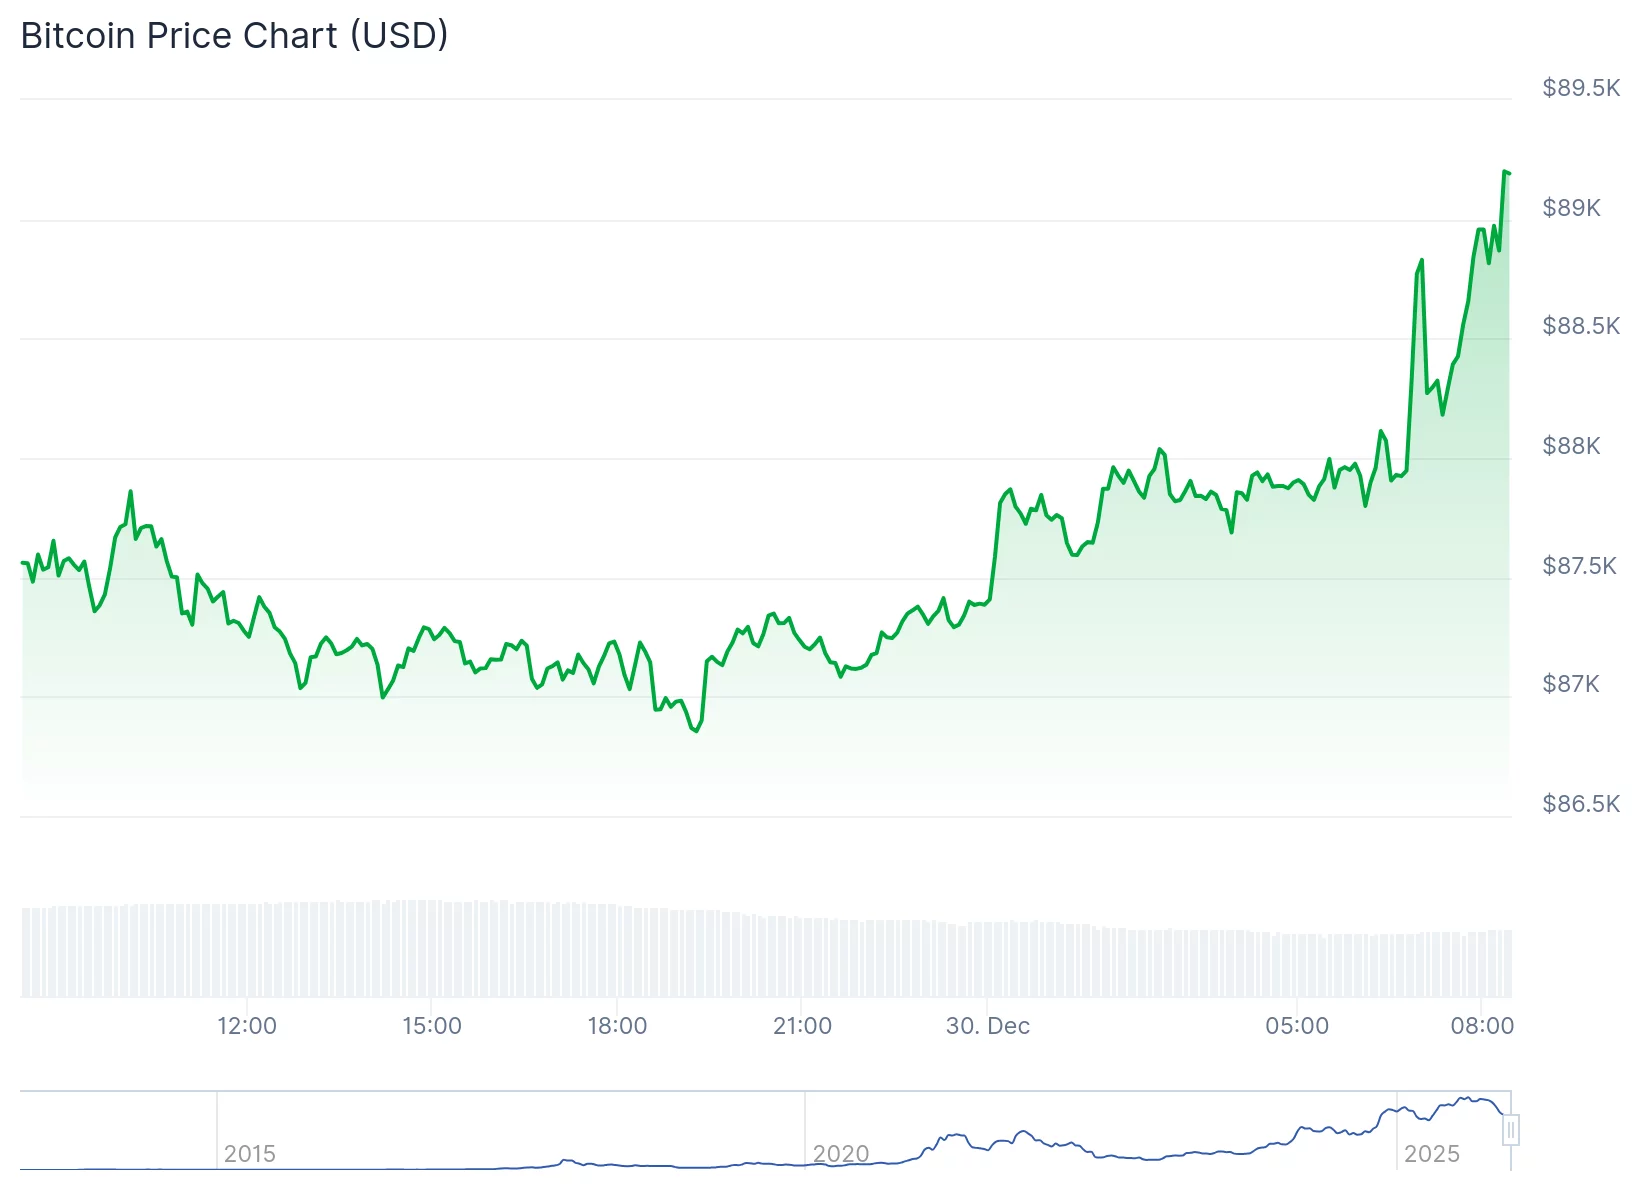
The Bitcoin price has entered a technical bear market, having fallen by about 30% from its all-time high of $126,250 to the current $89,000.
- Bitcoin has also formed several bearish chart patterns, indicating a deeper decline in the coming weeks.
- The Federal Reserve will publish minutes of the last monetary policy meeting at 2 p.m. EST.
- A Polymarket poll with over $1 million in assets predicts that the Fed will cut rates two times, with others expecting three cuts.
Bitcoin (BTC) has also formed several bearish chart patterns, indicating a deeper decline in the coming weeks ahead of the Federal Open Market Committee (FOMC) minutes.
These minutes, which will be released at 2:00 p.m. Eastern Time, will provide additional detail on what happened in the last meeting. The Federal Reserve decided to cut interest rates by 0.25% for the third consecutive time this year.
Officials brought rates to between 3.50% and 3.75% and hinted that it will deliver one more cut in the coming year. However, most analysts believe that the bank will deliver more cuts.
A Polymarket poll with over $1 million in assets predicts that it will cut rates two times, with others expecting three cuts.
Bitcoin price technical analysis as bearish patterns forms

The weekly timeframe chart shows that Bitcoin started a bull run at $15,460 on November 22 to a record high of $126,200 in October this year.
There are signs that the bull run is ending as it has formed several bearish chart patterns. For example, the token has formed a rising wedge, which is made up of two ascending and converging trendlines.
The coin is in the process of forming a bearish pennant pattern, which is made up of a vertical line and a symmetrical triangle pattern. The two triangles are now nearing their confluence, meaning that a bearish breakout is about to happen.
Oscillators have also formed a bearish divergence pattern. For example, the Percentage Price Oscillator peaked in April last year and recently moved below the zero line. The Relative Strength Index has moved below the neutral point at 50 and is pointing downwards.
Most importantly, the coin has moved below the Supertrend indicator, which turned red in November. The last time this occurred was in January 2022, and it declined from $52,000 to $15,460 thereafter.
Therefore, Bitcoin price will likely have a strong bearish breakout, potentially to the key support level at $74,368, its lowest level in April last year. A move below that level will indicate further downside, potentially to the psychological level at $70,000.
2026 predictions
After a year of blown calls — including Chamath Palihapitiya’s now-infamous “Bitcoin by October 2025” prediction — faith in crystal-ball price targets has taken a hit. By the end of 2025, “target-price narratives” were less prophecy and more cautionary tale, with analysts retreating to scenario ranges instead of bold guarantees.
According to a Wu Blockchain roundup, predictions now span a chasm wide enough to fit an entire bear market — from six-figure highs powered by ETF inflows and institutional demand to stomach-churning drawdowns if macro conditions tighten or technicals break.
- The bulls see Bitcoin climbing anywhere from $150,000 to $250,000, driven by spot ETFs, Wall Street adoption, and looser monetary policy.
- The bears warn of a potential drop to $70,000 or even $60,000.
The one point of agreement? Bitcoin’s fate in 2026 will hinge less on halving folklore and more on liquidity, regulation, and whether institutions continue to buy when the chart stops cooperating.


You May Also Like

Leap Wallet to Shut Down by May 28 as Team Winds Down Apps and Validator

Crypto Sectors Reveal Striking Divergence: 5 Explosive Gainers and 5 Troubled Decliners in 2025


