TLDR: Memecoin dominance fell to 0.032 ratio in December 2025, down from 0.11 peak in November 2024 rally PEPE surged 64% in seven days while BONK gained 59% andTLDR: Memecoin dominance fell to 0.032 ratio in December 2025, down from 0.11 peak in November 2024 rally PEPE surged 64% in seven days while BONK gained 59% and

Memecoin Market Rebounds From Historical Lows as Major Tokens Post Double-Digit Gains

2026/01/05 03:32
3 min read
For feedback or concerns regarding this content, please contact us at [email protected]

TLDR:

  • Memecoin dominance fell to 0.032 ratio in December 2025, down from 0.11 peak in November 2024 rally
  • PEPE surged 64% in seven days while BONK gained 59% and PENGU rose 34% during the market recovery
  • Total memecoin market capitalization exceeded $45 billion, marking a 20% increase within one week
  • Historical patterns suggest large-cap memecoins move first before capital rotates to smaller caps

Memecoins are showing renewed strength after reaching their lowest market share in December 2025. The altcoin segment, which peaked during November 2024’s speculative rally, has begun reversing its prolonged decline.

Recent trading sessions indicate growing investor interest in major memecoin assets. This development follows a year-long period of market contraction and reduced dominance within the broader cryptocurrency landscape.

Market Dominance Shifts Signal Potential Reversal

The memecoin sector experienced substantial contraction following the November 2024 rally peak. Market dominance within the altcoin space fell dramatically over the subsequent months.
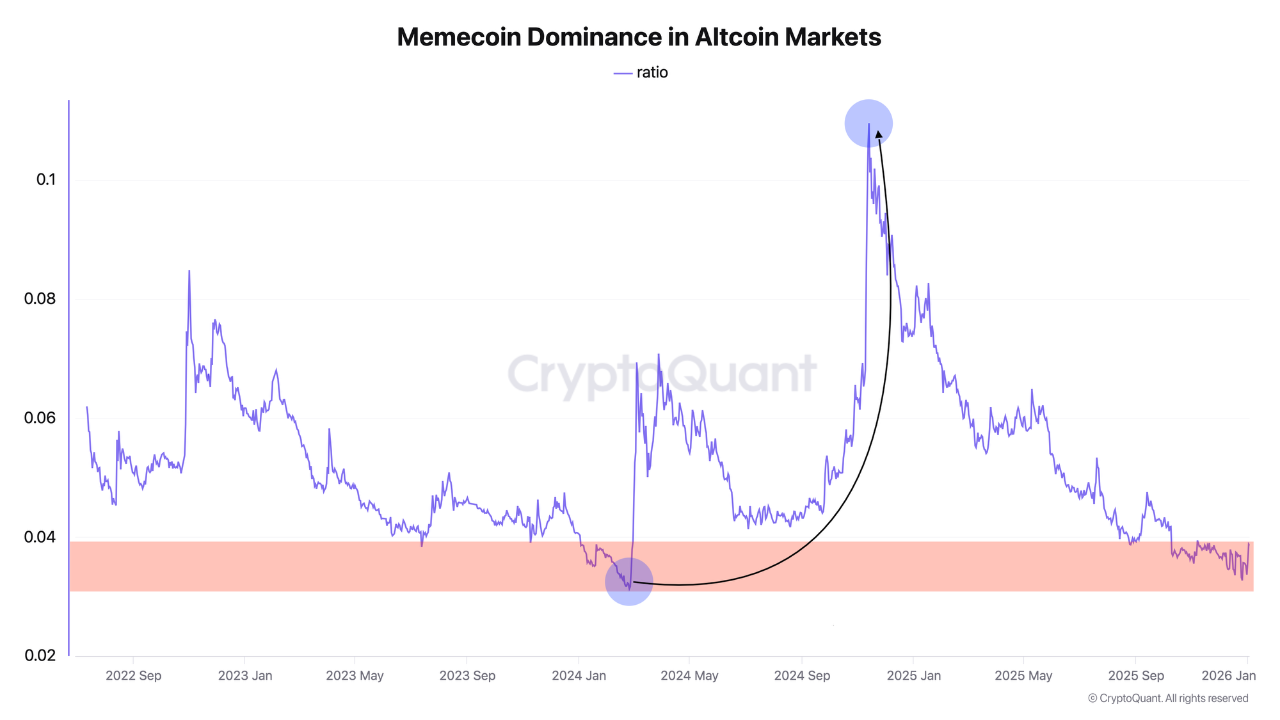
 quicktake-image

                                                      Source: Cryproquant

By December 2025, the ratio between major altcoins and leading memecoins reached 0.032. This figure represents just 3.2% of total altcoin market capitalization.

The decline marked a sharp reversal from earlier periods of market strength. During November 2024, memecoins commanded 11% of altcoin market capitalization with a ratio of 0.11. 

Historical patterns suggest such extreme lows often precede renewed memecoin activity. Previous cycles demonstrated similar compression phases before major rallies materialized.

Market observers note the current levels mirror conditions that preceded earlier memecoin seasons. The compression in market share created a technical setup some analysts view as favorable. 

However, the early stage of this potential reversal requires careful monitoring. Confirmation of sustained momentum remains pending across multiple trading sessions.

Price Performance and Historical Patterns Emerge

Recent price action across major memecoins shows coordinated strength returning to the sector. Analyst commentary from @Ucan_Coin highlights PEPE gaining 64% over seven days. 

BONK advanced 59% during the same period while PENGU posted 34% gains. These movements coincide with Bitcoin reclaiming the $91,000 level.

Total memecoin market capitalization surpassed $45 billion, representing a 20% weekly increase. The performance mirrors historical cycles where large-cap memecoins move first before capital rotation occurs. 

Previous market cycles in 2021 demonstrated similar patterns with DOGE and SHIB. Initial skepticism preceded substantial price appreciation in both cases.

The current setup draws comparisons to earlier phases of memecoin market development. Liquidity flows typically begin with established tokens before spreading to smaller projects. 

Volume expansion in major memecoins often signals broader sector interest developing. Early-stage projects with community support may benefit from this rotation pattern.

Risk management remains essential given the speculative nature of memecoin investments. Market participants are advised to exercise caution despite improving technical indicators. 

The recovery phase is still nascent and requires validation through sustained trading activity.

The post Memecoin Market Rebounds From Historical Lows as Major Tokens Post Double-Digit Gains appeared first on Blockonomi.

Market Opportunity
Major Logo
Major Price(MAJOR)
$0.06207
$0.06207$0.06207
+0.61%
USD
Major (MAJOR) Live Price Chart
Disclaimer: The articles reposted on this site are sourced from public platforms and are provided for informational purposes only. They do not necessarily reflect the views of MEXC. All rights remain with the original authors. If you believe any content infringes on third-party rights, please contact [email protected] for removal. MEXC makes no guarantees regarding the accuracy, completeness, or timeliness of the content and is not responsible for any actions taken based on the information provided. The content does not constitute financial, legal, or other professional advice, nor should it be considered a recommendation or endorsement by MEXC.
Tags:

You May Also Like

Today’s Biggest Crypto Movers: Dogecoin Leads the Pack

Today’s Biggest Crypto Movers: Dogecoin Leads the Pack

Today's Biggest Crypto Movers: Dogecoin Leads the Pack 🚀 Crypto Markets Heat Up Today Major cryptocurrencies are showing strong gains. Let's dive into today's top
Share
Blockchainmagazine2026/04/03 13:00
RWA Boom Accelerates As Tokenized Assets Hit New Highs In Early 2026

RWA Boom Accelerates As Tokenized Assets Hit New Highs In Early 2026

RWA distributed value rose from about $21B to $27.5B in Q1 2026, a gain of roughly 30%. Tokenized US Treasuries reached about $10B, creating an on-chain yield base
Share
LiveBitcoinNews2026/04/03 13:00
Cryptos Signal Divergence Ahead of Fed Rate Decision

Cryptos Signal Divergence Ahead of Fed Rate Decision

The post Cryptos Signal Divergence Ahead of Fed Rate Decision appeared on BitcoinEthereumNews.com. Crypto assets send conflicting signals ahead of the Federal Reserve’s September rate decision. On-chain data reveals a clear decrease in Bitcoin and Ethereum flowing into centralized exchanges, but a sharp increase in altcoin inflows. The findings come from a Tuesday report by CryptoQuant, an on-chain data platform. The firm’s data shows a stark divergence in coin volume, which has been observed in movements onto centralized exchanges over the past few weeks. Bitcoin and Ethereum Inflows Drop to Multi-Month Lows Sponsored Sponsored Bitcoin has seen a dramatic drop in exchange inflows, with the 7-day moving average plummeting to 25,000 BTC, its lowest level in over a year. The average deposit per transaction has fallen to 0.57 BTC as of September. This suggests that smaller retail investors, rather than large-scale whales, are responsible for the recent cash-outs. Ethereum is showing a similar trend, with its daily exchange inflows decreasing to a two-month low. CryptoQuant reported that the 7-day moving average for ETH deposits on exchanges is around 783,000 ETH, the lowest in two months. Other Altcoins See Renewed Selling Pressure In contrast, other altcoin deposit activity on exchanges has surged. The number of altcoin deposit transactions on centralized exchanges was quite steady in May and June of this year, maintaining a 7-day moving average of about 20,000 to 30,000. Recently, however, that figure has jumped to 55,000 transactions. Altcoins: Exchange Inflow Transaction Count. Source: CryptoQuant CryptoQuant projects that altcoins, given their increased inflow activity, could face relatively higher selling pressure compared to BTC and ETH. Meanwhile, the balance of stablecoins on exchanges—a key indicator of potential buying pressure—has increased significantly. The report notes that the exchange USDT balance, around $273 million in April, grew to $379 million by August 31, marking a new yearly high. CryptoQuant interprets this surge as a reflection of…
Share
BitcoinEthereumNews2025/09/18 01:01

Trade GOLD, Share 1,000,000 USDT

Trade GOLD, Share 1,000,000 USDTTrade GOLD, Share 1,000,000 USDT

0 fees, up to 1,000x leverage, deep liquidity