Chainlink price prints double bottom at $12, macro reversal forming?
Chainlink price is holding a critical high-time-frame support zone, where a developing double bottom pattern could signal a potential macro trend reversal.
- LINK is holding high-time-frame support at $12 in confluence with the value area low and POC
- A double bottom pattern is forming, but remains unconfirmed
- A breakout could target $19 resistance, signalling a potential macro trend shift
Chainlink’s (LINK) current price action is reaching an important inflection point as the market continues to consolidate around the $12 region. This area has emerged as a high-time-frame support zone, defined by strong volume confluence and repeated defensive reactions from buyers.
As price continues to hold this region, the broader structure suggests the early stages of a potential macro reversal may be forming.
Chainlink price key technical points
- Chainlink is holding high-time-frame support at $12, aligned with the value area low
- The Point of Control is in confluence with this support, reinforcing its significance
- A developing double bottom structure targets a potential move toward $19 resistance
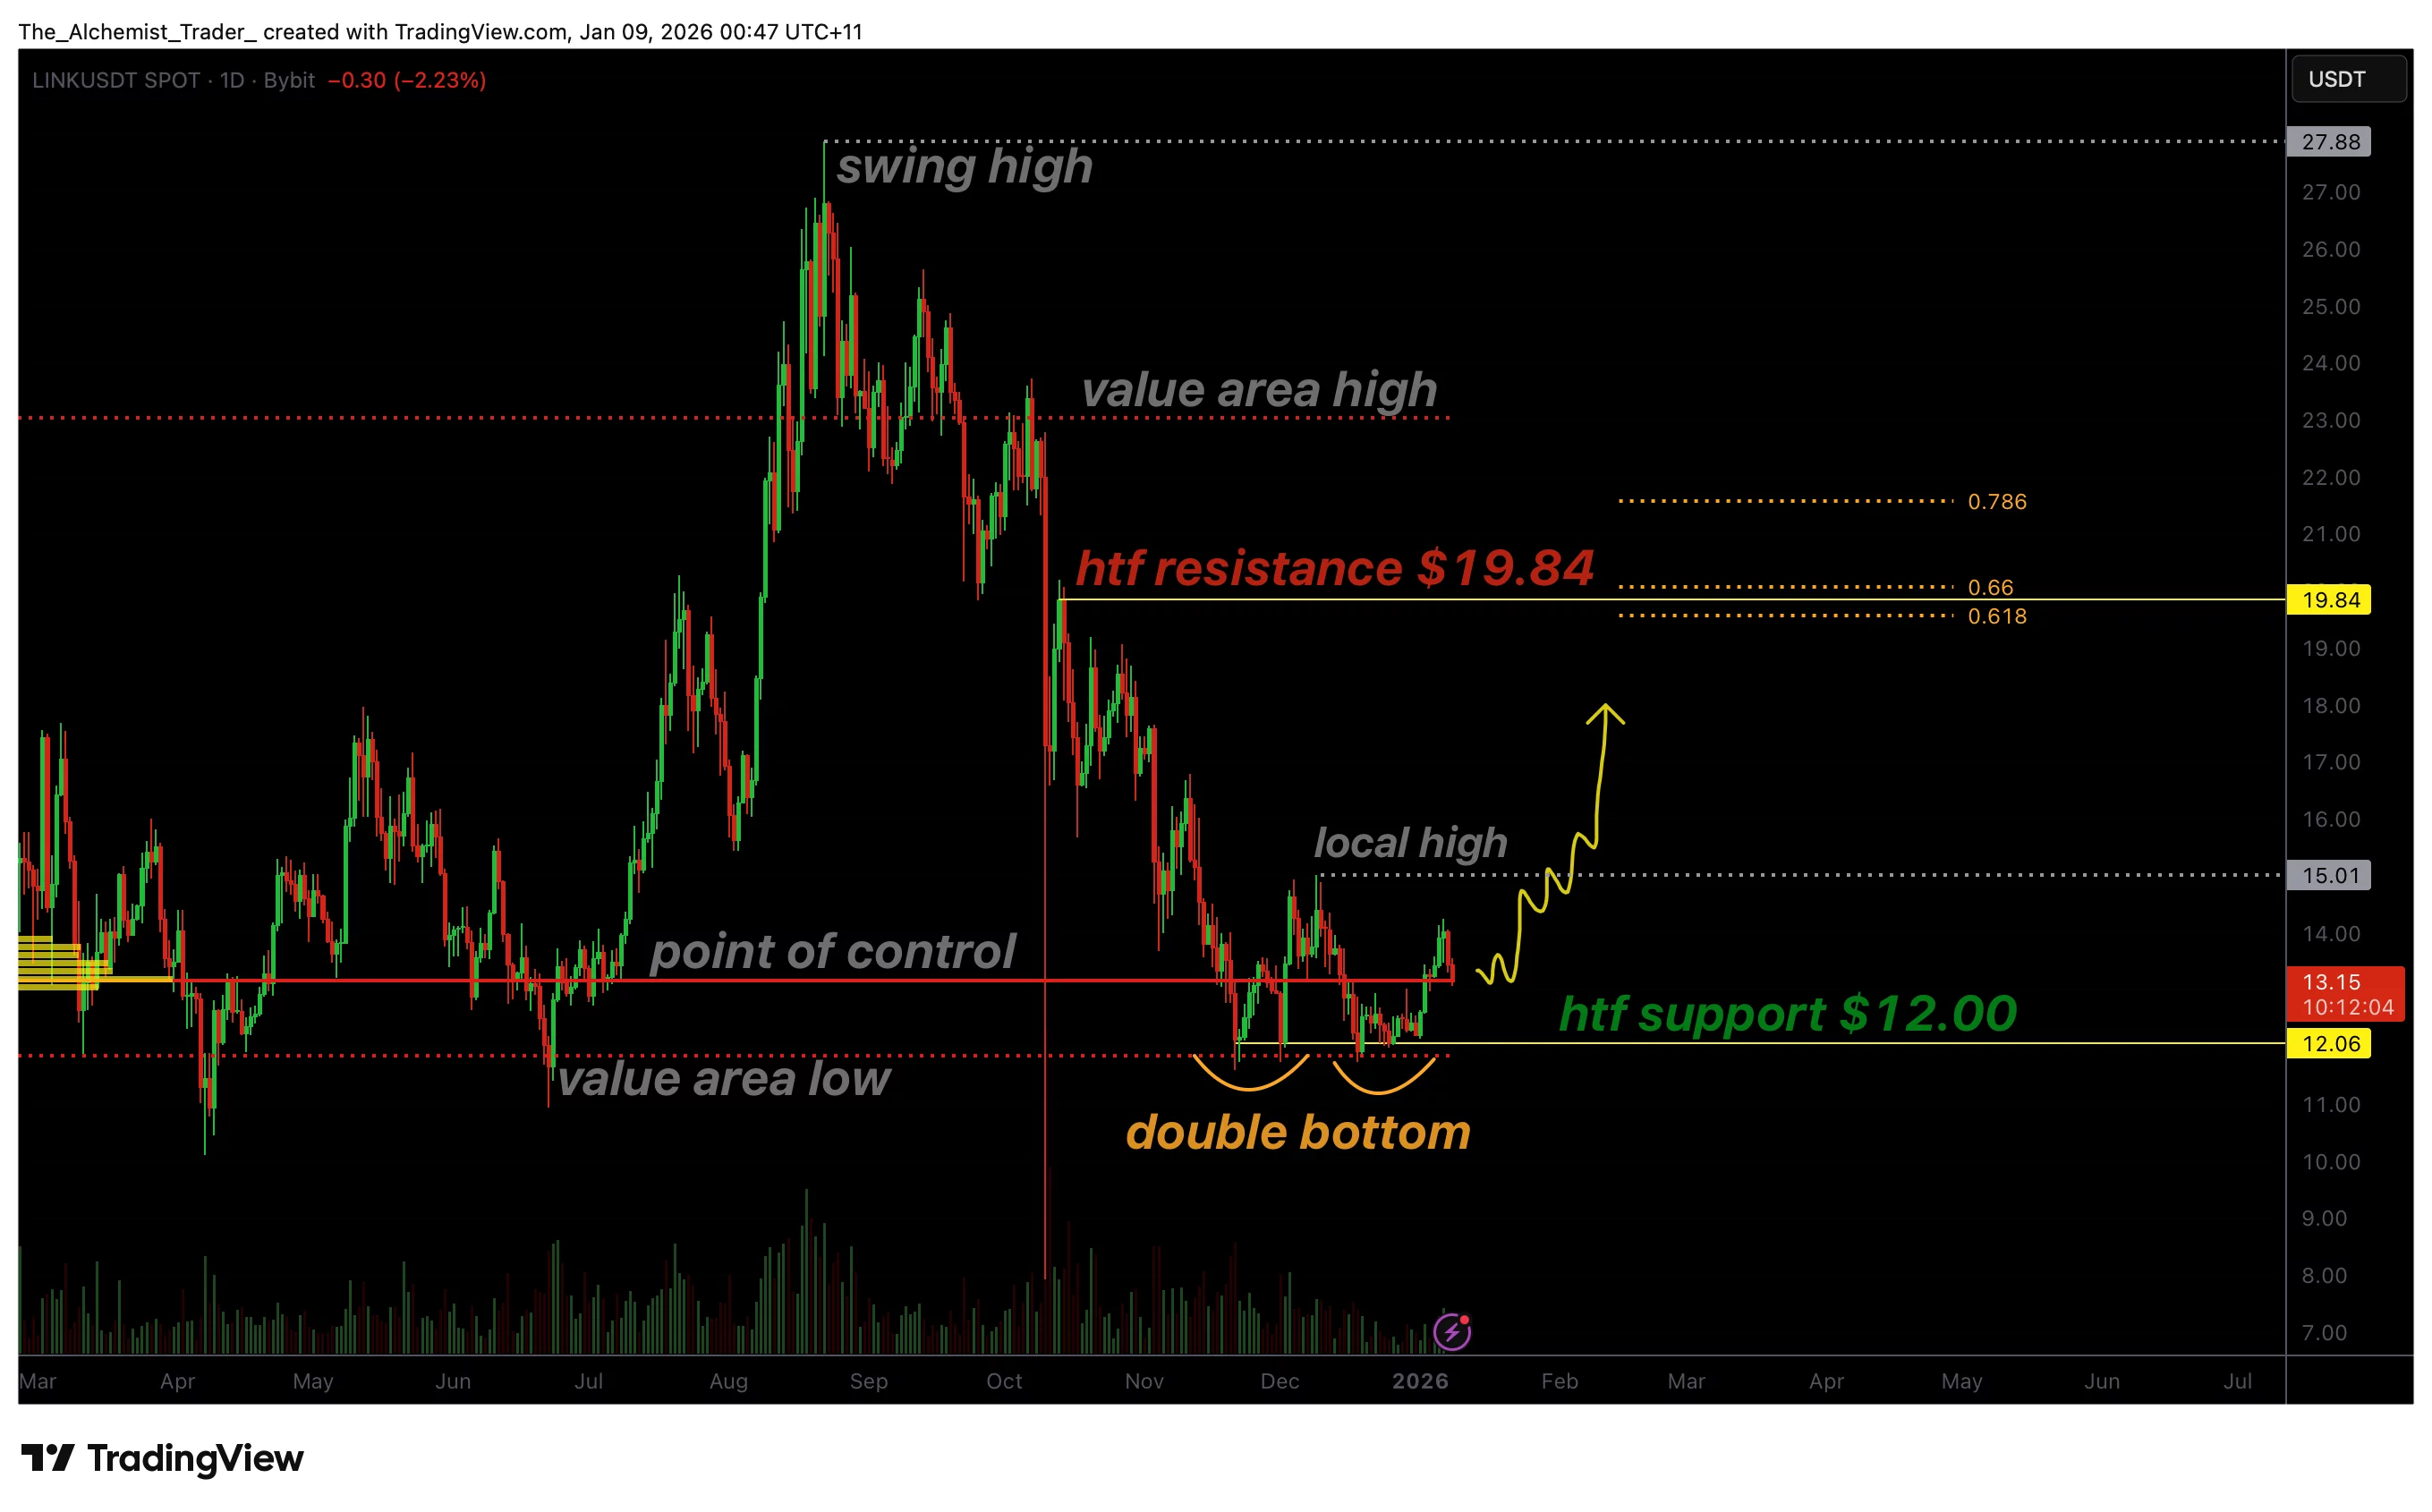
The $12 region has proven to be a critical area for Chainlink, acting as a zone of acceptance where price continues to find support. This level aligns with both the value area low and the Point of Control from a market profile perspective, indicating that the majority of historical trading activity has taken place around this price.
Repeated reactions from this zone suggest that sellers are struggling to push price lower, while buyers are increasingly willing to defend the level. This behavior is characteristic of base-building phases, where distribution gives way to accumulation over time, a dynamic that is gaining further relevance as BitMEX integrates Chainlink to support 24/7 equity perpetual trading, reinforcing the network’s growing institutional utility.
The current structure is beginning to resemble a double bottom pattern, a classic reversal formation that often precedes trend changes. However, the pattern has not yet been confirmed. The broader bearish structure remains intact as long as price continues to print lower highs, meaning confirmation is still required before any sustained upside can develop.
Resistance Levels and Upside Targets
If confirmation occurs, the next major area of interest sits around the $19 region. This level is significant for several reasons, including the presence of the 0.618 Fibonacci retracement and a major daily resistance zone. Together, these factors create a strong upside objective if bullish momentum builds.
A move toward $19 would represent a meaningful rally from current prices and signal improving market structure on higher time frames. However, this scenario depends heavily on price maintaining acceptance above $12 and breaking through overhead resistance levels that have capped previous rallies.
Failure to reclaim resistance would keep Chainlink locked within its broader range, delaying any macro trend change and increasing the risk of continued consolidation.
Market Structure Perspective
From a market-structure standpoint, Chainlink remains in a corrective phase within a broader downtrend. The presence of a double bottom does not automatically confirm a reversal, but it does highlight an area where risk-reward conditions may begin to improve for buyers if confirmation follows.
The $12 support level remains the line in the sand. As long as price holds above this region, the probability of a reversal structure remains valid. A decisive break below support would invalidate the setup and reopen downside risk.
What to expect in the coming price action
A confirmed breakout would open the door for a rotation toward $19, while continued rejection from resistance would keep Chainlink range-bound. From a price action, market structure, and support perspective, Chainlink is currently positioned at a key decision point where a macro reversal could begin to take shape if bullish confirmation emerges.
Until that confirmation occurs, patience remains essential, as the next move from this region is likely to define Chainlink’s broader directional bias.


You May Also Like

Next Crypto to Explode: Altcoin Season Jumps as Pepeto Targets 100x

Solana Price Prediction as Exchange Supply Surges