

Mubarak Builds Momentum for a Possible $0.07 Breakout Move
Mubarak stayed in focus as the token gained momentum in its upward trend by entering the market more actively. Price action remained strong following a sudden day of upward movement. The traders were following the momentum indicators and awaiting confirmation of the clear breakout.
As of press time, Mubarak (Mubarak) was trading at $0.02181, marking an 11.31% increase in the last 24 hours. The trading volume increased by 24.53%, and market capitalization was at $21.78 million. The token price has increased by 21.03 over the past seven days.
Source: CoinMarketCap
Mubarak Nears Rounding Bottom Breakout
Analyst Crypto Bull highlighted that Mubarak seems to be getting ready to break out of the rounding bottom resistance zone in the short term. A significant increase in volume was one of the indicators of greater momentum pointed out by the analyst. The traders will need to continue monitoring the setup to confirm before making a bigger move.
Source: X
Moreover, Whales Crypto, another analyst, mentioned that Mubarak is approaching the top of a falling wedge chart on the 4-hour chart. The analyst indicated that a confirmed breakout may drive the price to $0.07. This perception emphasizes wedge resistance, which tends to be the decisive point of directional expansion.
Source: X
Mubarak Sees 41% Volume Jump And Rising Open Interest
CoinGlass data shows that trading volume grew by 41.75% to $31.70 million. Open interest is also up by 16.08% to $9.79 million, indicating the addition of more positions. The OI-weighted funding rate stood at 0.0056%, which would reflect a mild bullish bias.
Source: CoinGlass
Also Read: Ethereum Price Under Pressure as Whale Moves $124 Million ETH to Exchange
RSI Strengthens As Mubarak Holds Above Key EMAs
The RSI stood at 66.18, indicating increasing bullish pressure. The RSI moving average line hovered around 57.83, suggesting an improvement in momentum compared to the previous sessions. The chart showed RSI in the upper range but still below the extreme levels.
EMA values demonstrated that the price was above the important trend lines in the short term. The EMA 20 was 0.01853, and the EMA 50 was 0.01825, which was less than the current market value. EMA 100 was 0.02080, which remained below price and showed an upward trend direction. EMA 200 was at 0.02638, which is a longer-term resistance area over the market.
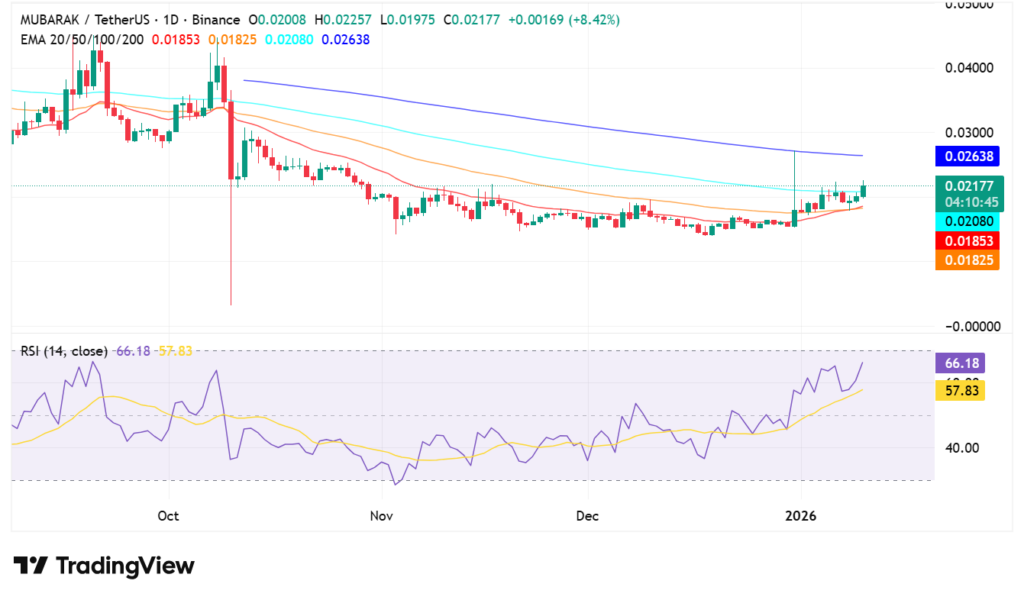
Source: TradingView
The existing chart format maintains the focus on the zones of resistance in the future. The EMA 200 at 0.02638 is an evident level that is above the price, which may serve as resistance. An extension to the breakout that analysts have highlighted would support it. In case momentum declines, the traders might refocus their attention on the EMA 20 and EMA 50 region as a support area.
Also Read: Hedera (HBAR) Draws Institutional Attention: Could It Push the Price Above $0.14?


You May Also Like

The changing face of elder care in Malaysia — Sayed Mohammad Reza Yamani Sayed Umar

Covéa Chooses Shift Technology as Strategic Partner for Fraud and Risk Management
Cango Inc. Closes $75M in Capital Deals to Fund AI and Bitcoin Mining Expansion


